in

Video Infographic : How to Show Survey Results in PowerPoint : Infographics Series

Video Infographic : How to Show Survey Results in PowerPoint : Infographics Series

Video

Description

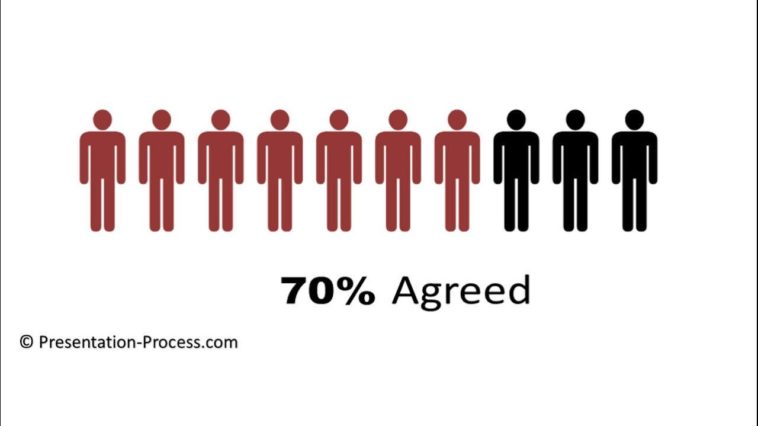
Learn how to show survey results in PowerPoint with an interesting symbol that is available within PowerPoint. This tutorial helps you find useful icons that are already available in PowerPoint, but many presenters may not be aware of.

Product showcased in this video:
320+ Data Driven Visual PowerPoint Graphs Pack

  • Don’t forget to share this video with your friends !
  • What do you think?

    459 points
    Upvote Downvote

    Leave a Reply

    Your email address will not be published. Required fields are marked *

    Loading…

    Video Infographic : Why Is Monaco So Rich?

    Visual : The flora and fauna you can find in New York City