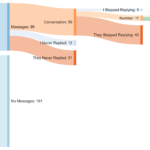
Data Chart : The State Of The Blogging Industry In 2018 [Infographic

Learn more about blogging in 2018 and what it takes to create a successful website. If you're a business owner, you should be blogging, and this infographic tells you how to make it happen.