in

Video Infographic : Creating Infographics using Canva

Video Infographic : Creating Infographics using Canva

Video

Description

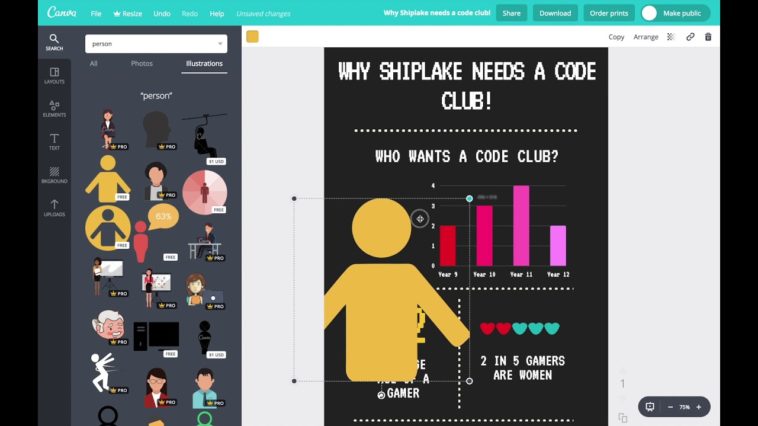
In this video, you will learn to use the online graphics app Canva to make an infographic based on data that has been collected from conducting an online survey.

Learn to make visually engaging infographics that make a great impact and get across your findings and research in a really effective way!

  • Don’t forget to share this video with your friends !
  • What do you think?

    459 points
    Upvote Downvote

    Leave a Reply

    Your email address will not be published. Required fields are marked *

    Loading…

    Visual : A Guide: Haeckel’s Pedigree of Man

    Data Chart : How To Stay Healthy & Comfortable On Long Flights [Infographic