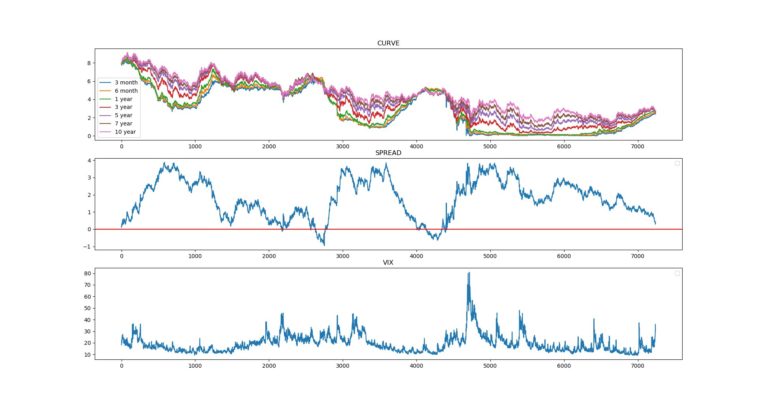
Data visualization : Yield Curve Visualization with 3 month vs 10 year spread comparison. Yield curve approaching inversion for first time since 2006. First [OC]
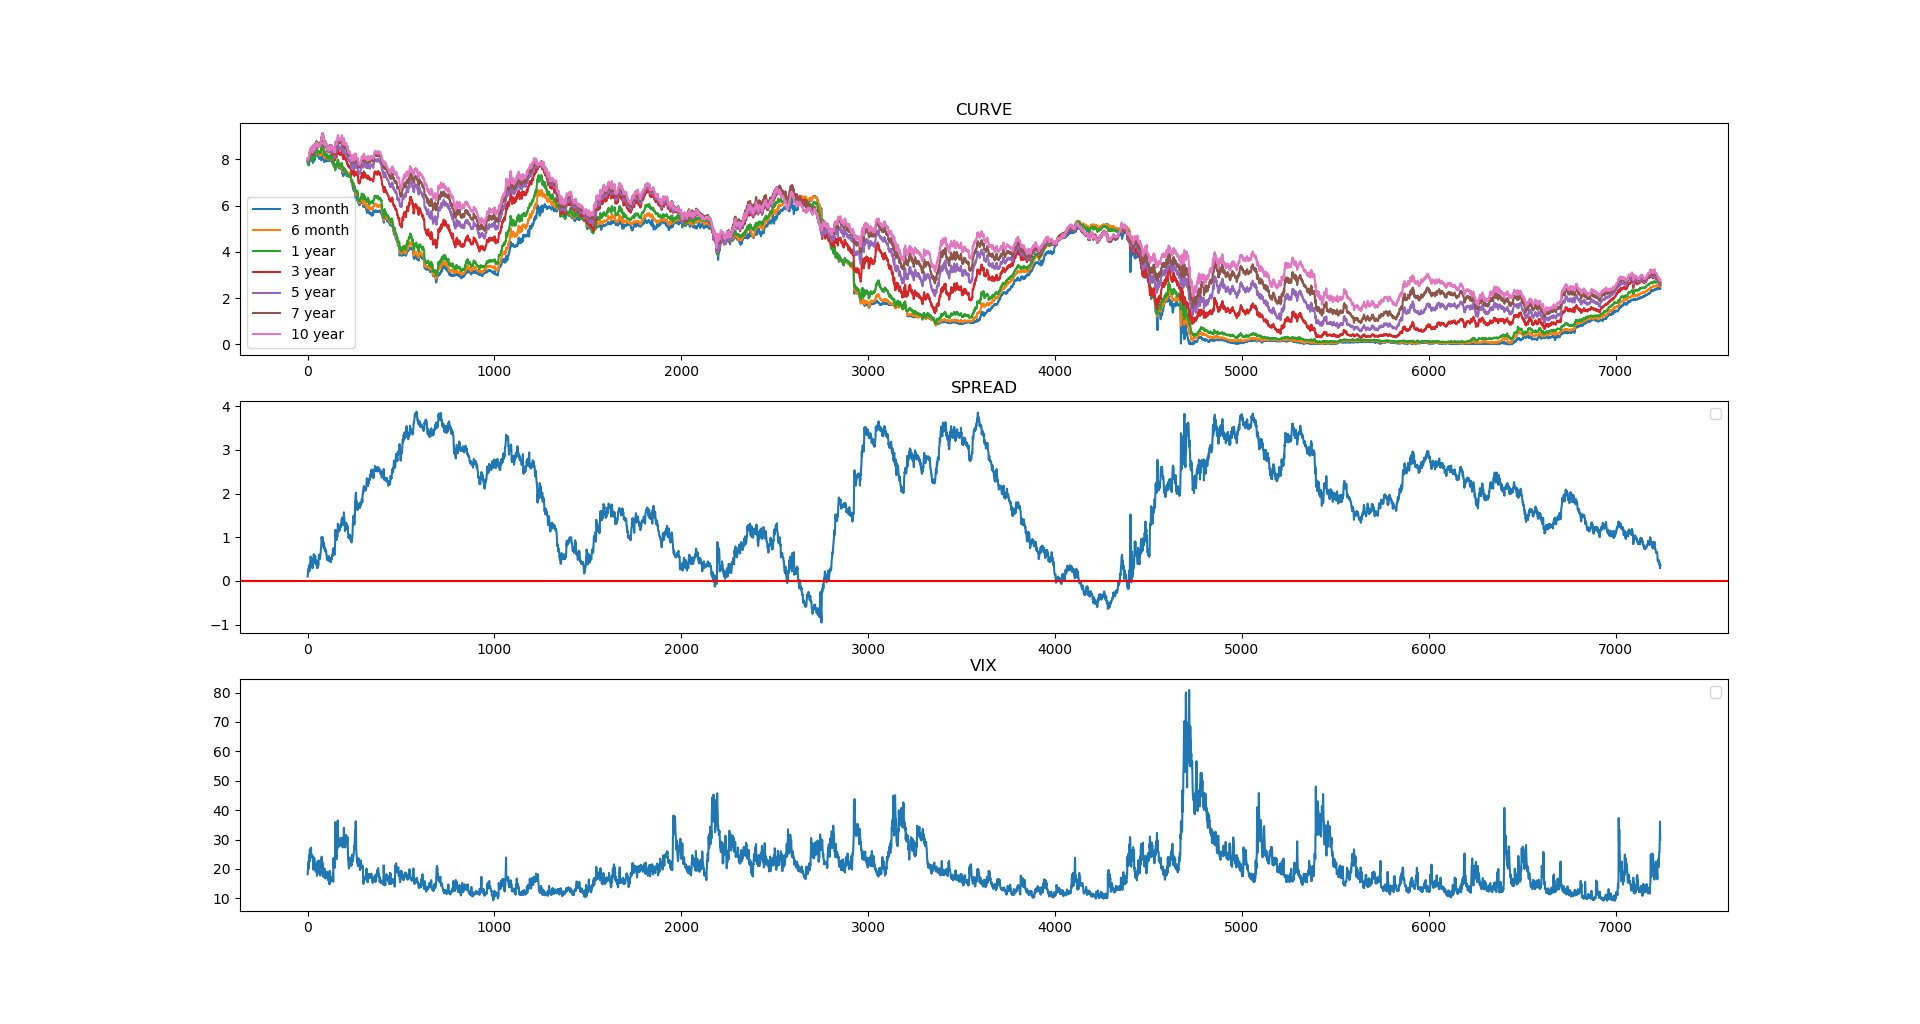
Yield Curve Visualization with 3 month vs 10 year spread comparison. Yield curve approaching inversion for first time since 2006. First [OC]
By Silver5005
At infographic.tv we provide handpicked collection of the best infographics and data charts from around the world.