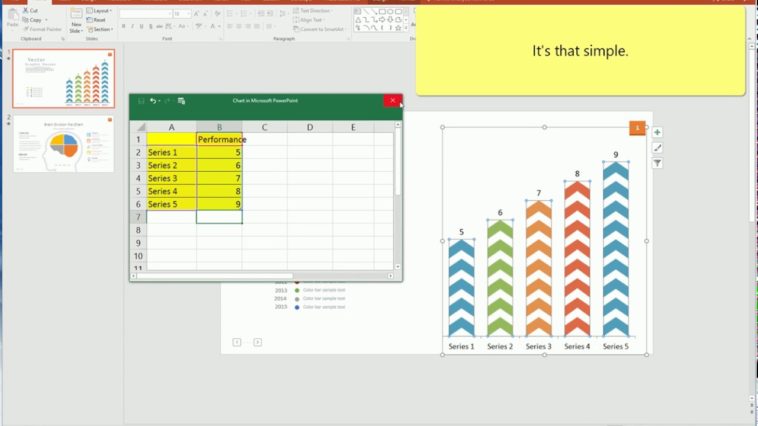
Video Infographic : How to edit Excel-Linked Infographics charts and graphs in PowerPoint.
Video
Description
See how easy Excel-linked infographics are to use in PowerPoint. Simply right-click the chart or graph and select ‘Edit Data’ and Excel will pop up. Add your data and the chart will change automatically.