in

data visualization : This season, I’ve been creating these “possible changes” charts for the Premier League (and others) and posting them in /r/soccer. Here we are at the halfway point. [OC]

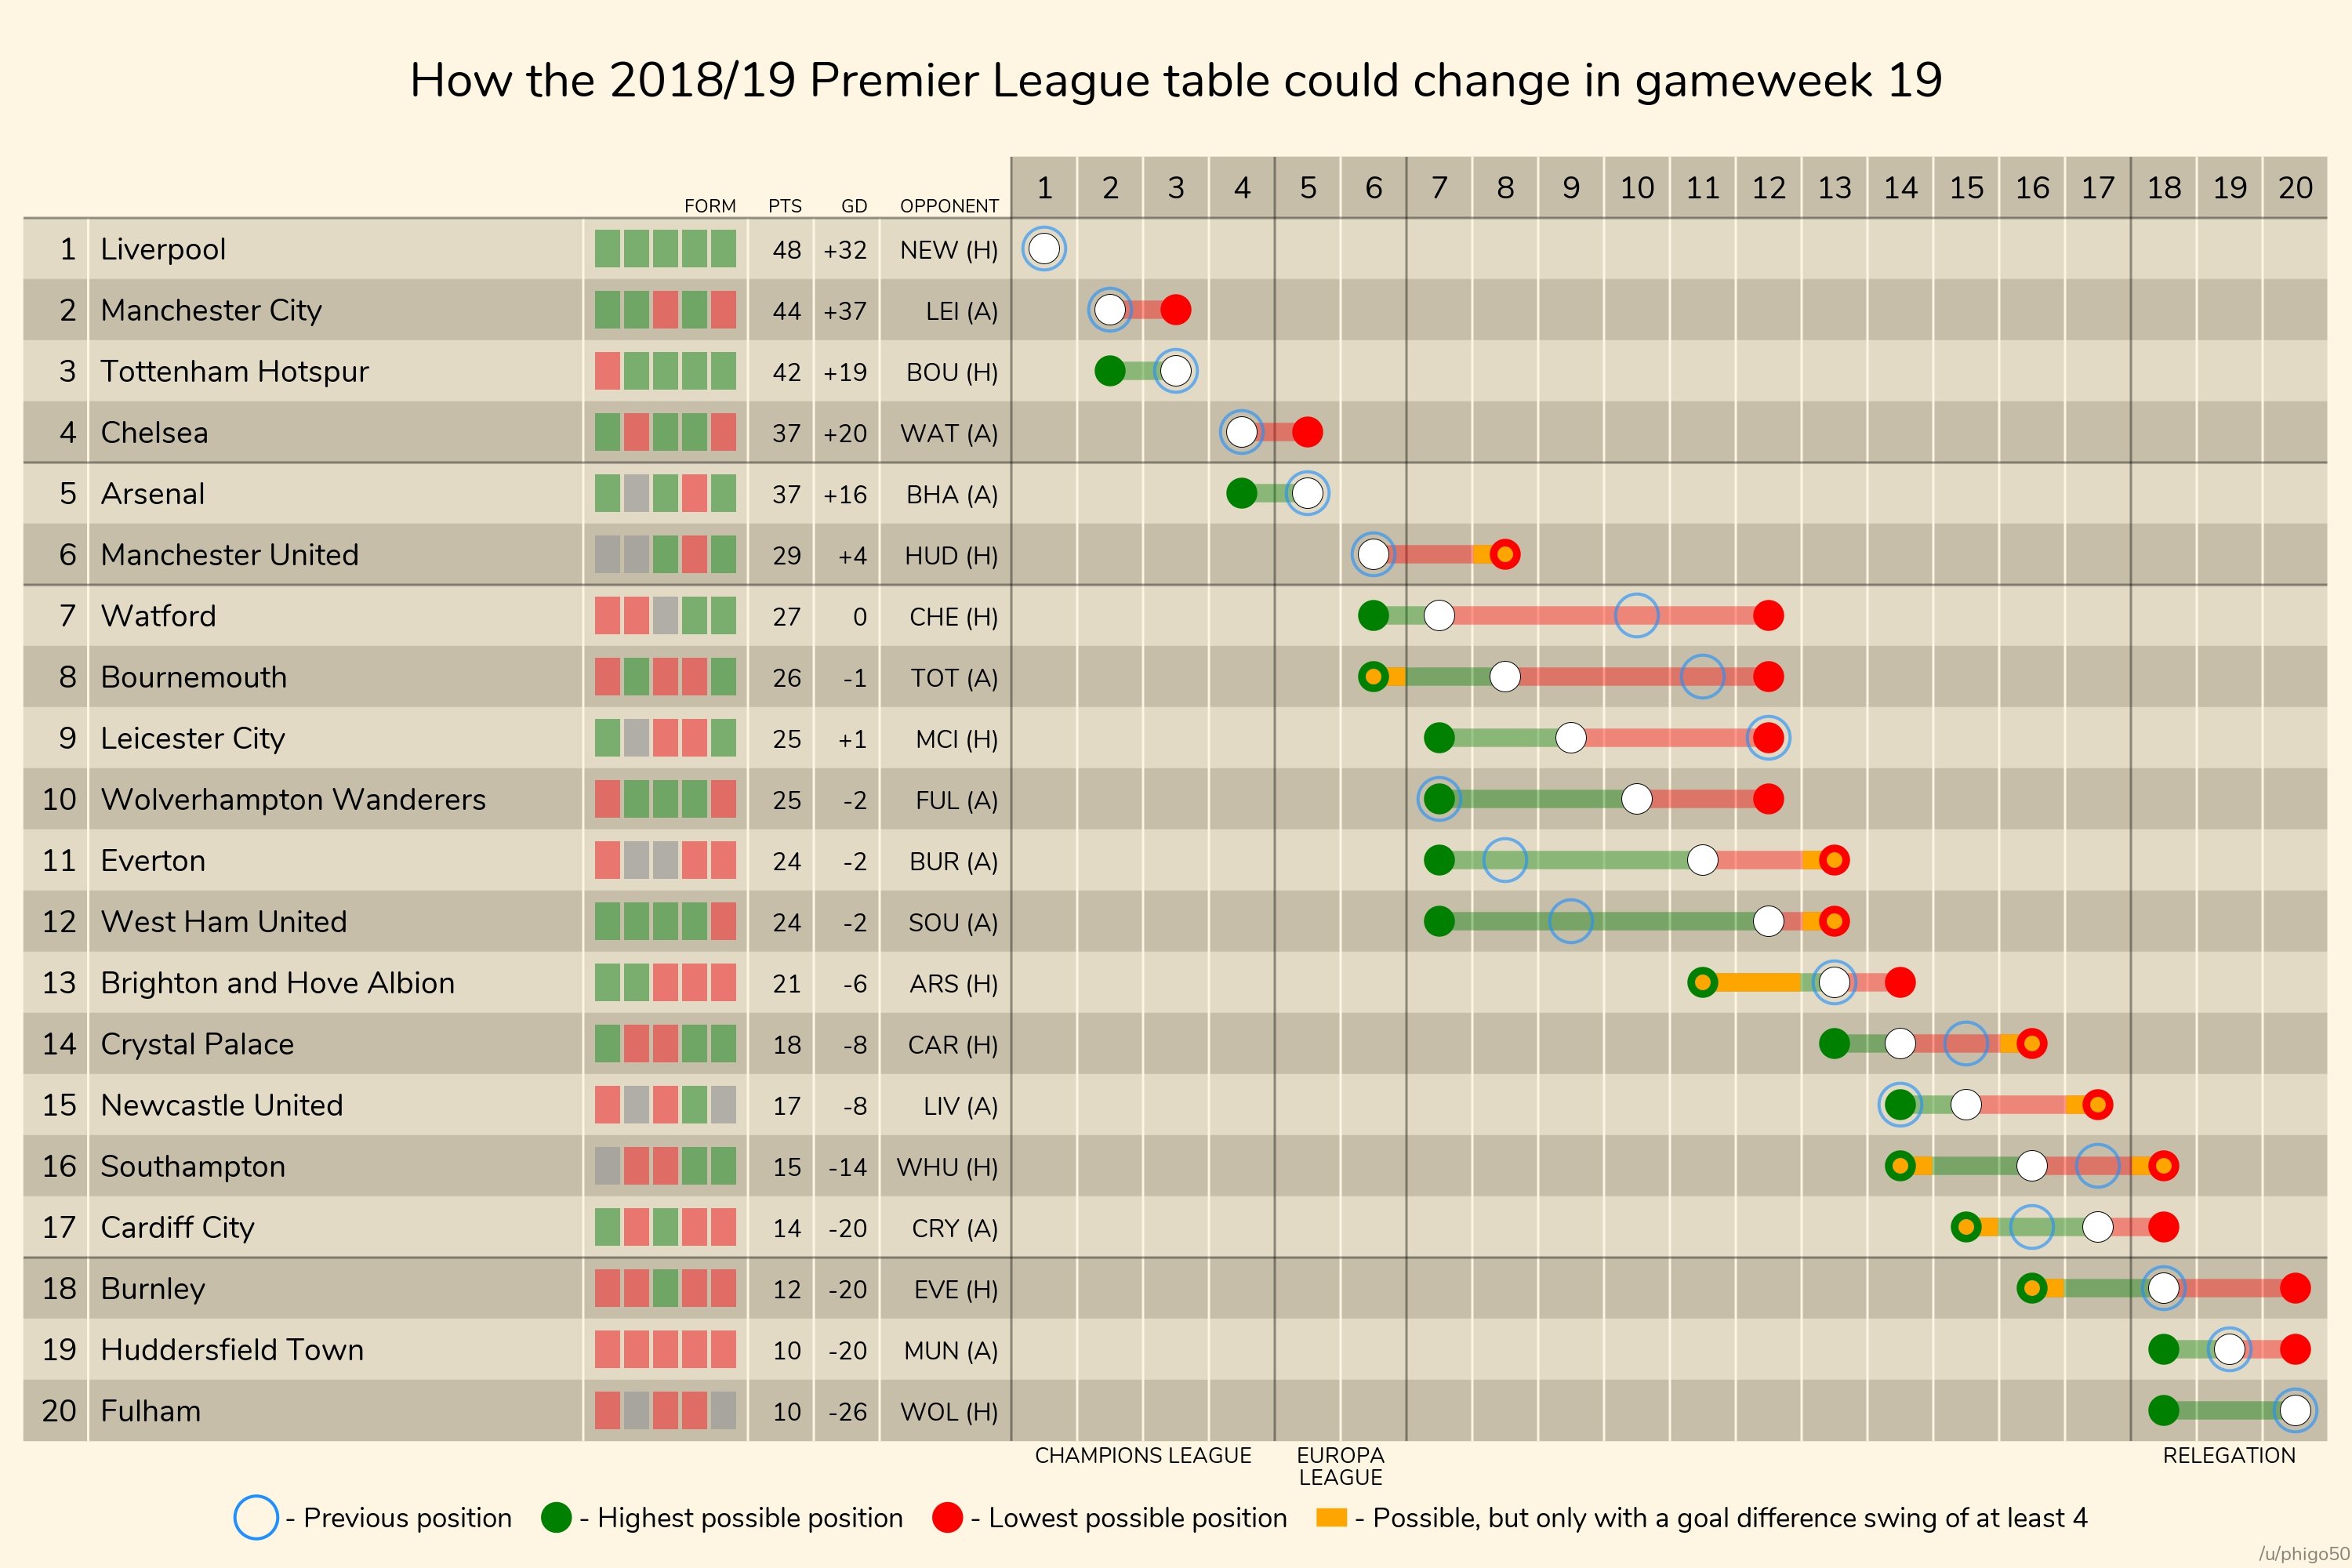
Data visualization : This season, I’ve been creating these “possible changes” charts for the Premier League (and others) and posting them in /r/soccer. Here we are at the halfway point. [OC]

This season, I’ve been creating these “possible changes” charts for the Premier League (and others) and posting them in /r/soccer. Here we are at the halfway point. [OC]

By phigo50

At infographic.tv we provide handpicked collection of the best infographics and data charts from around the world.

  • Don’t forget to share the love !
  • What do you think?

    459 points
    Upvote Downvote

    Leave a Reply

    Your email address will not be published. Required fields are marked *

    Loading…

    Video Infographic : Up To 28% Of All People Hear Voices – WHY?

    Video Infographic : How to Write an Infographic Brief