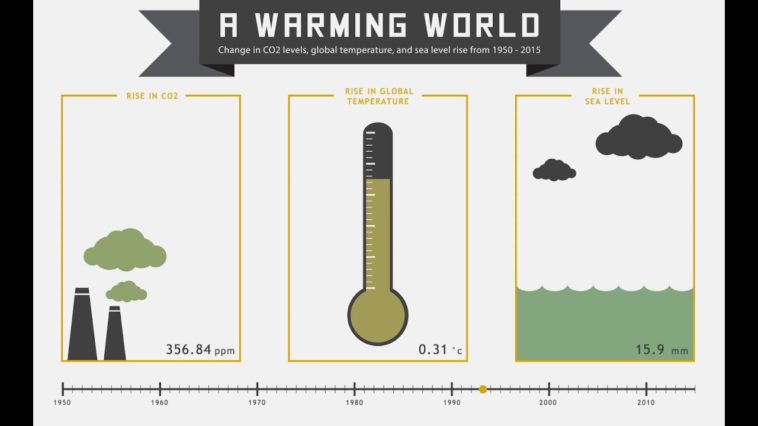
in Videos Infographics Video Infographic : Interactive Infographic January 16, 2019, 7:23 pm 14.9k Views 0 Comments Video Infographic : Interactive Infographic Video Description An interactive infographic displaying climate change data. Made with SVG, CSS, Javascript and D3.js in Adobe Brackets. Don’t forget to share this video with your friends ! 0 shares What do you think? 459 Points Upvote Downvote Leave a Reply Cancel replyYour email address will not be published. Required fields are marked *Comment * Name * Email * Website Next post