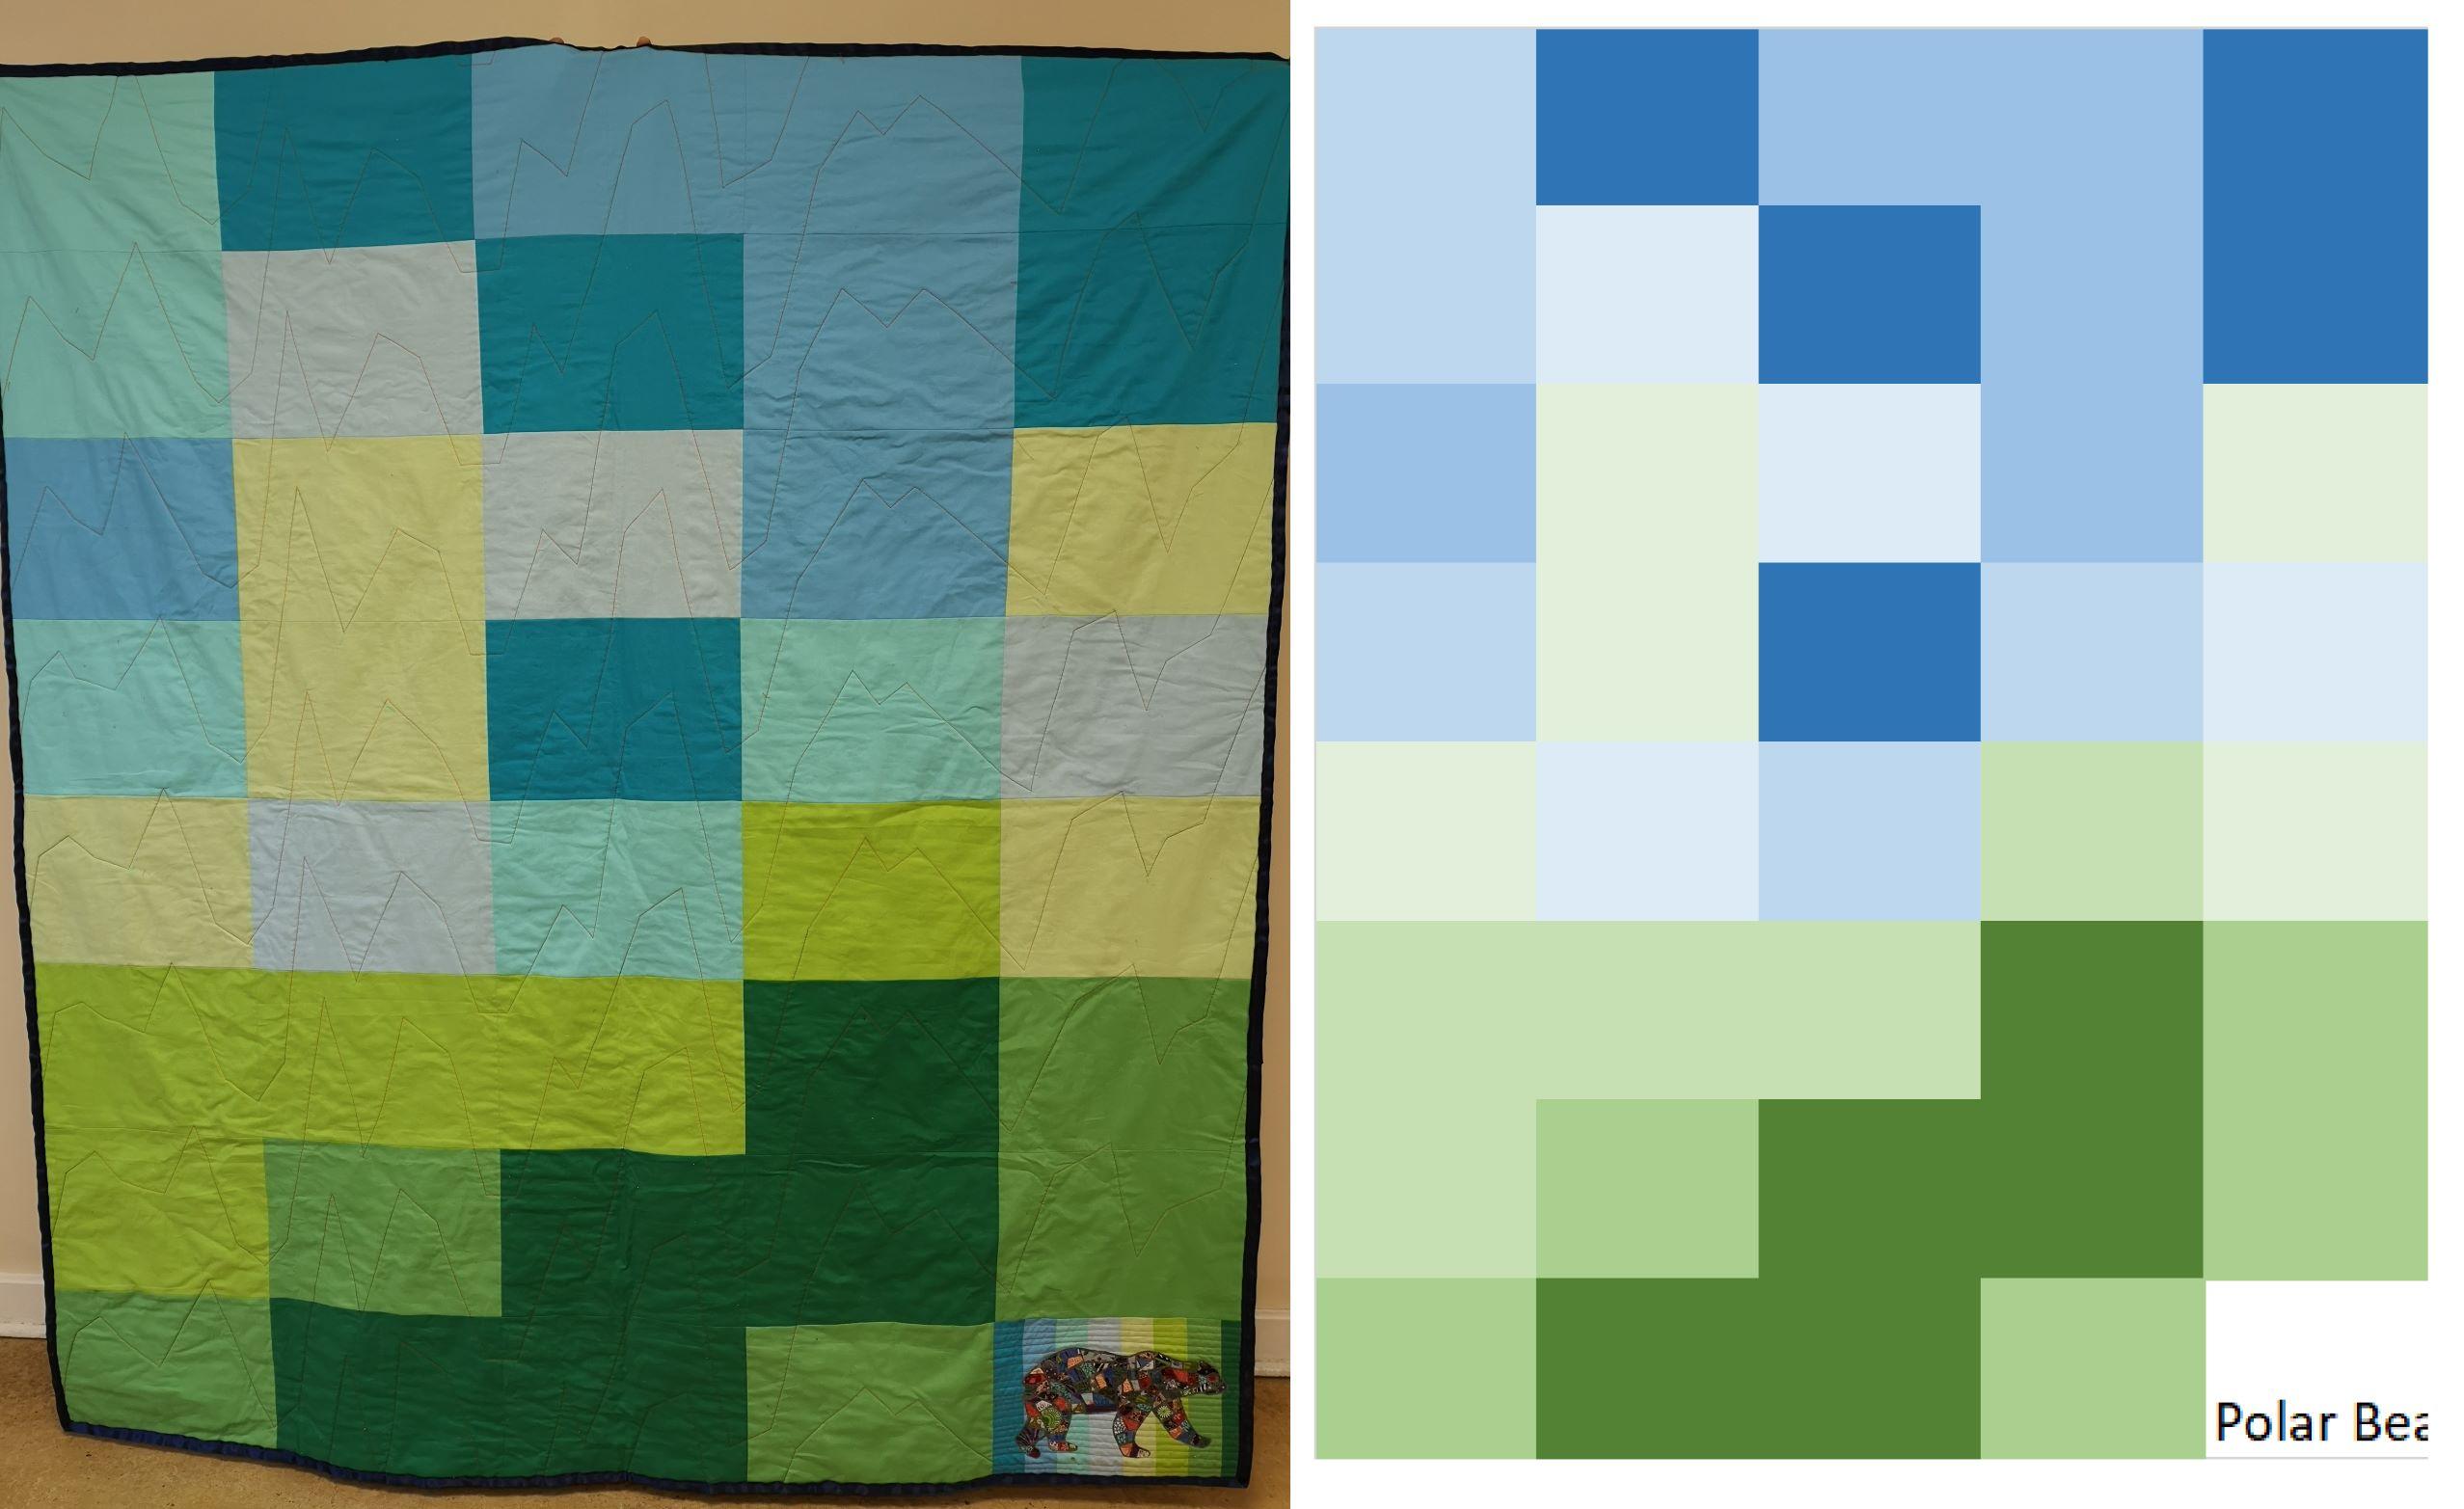
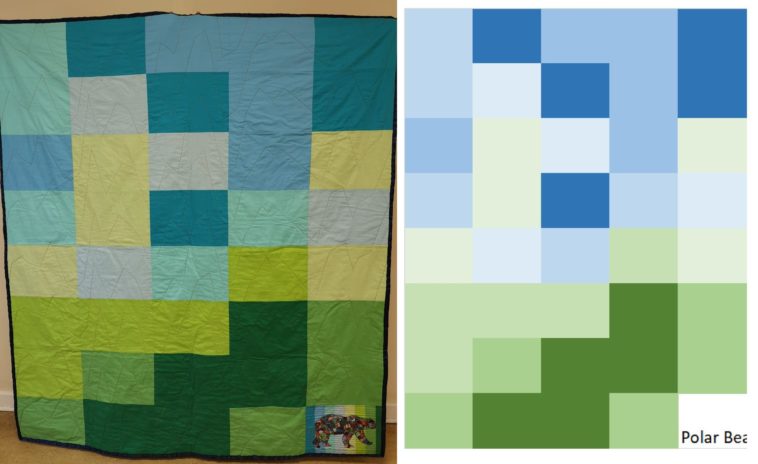
Data visualization : A data visualization, in quilt form. The coloured blocks represent the extent of arctic sea ice from 1979-2017, while the quilting shows the rising sea temperatures over the same time period. [OC]

A data visualization, in quilt form. The coloured blocks represent the extent of arctic sea ice from 1979-2017, while the quilting shows the rising sea temperatures over the same time period. [OC]
By RosiePB2
At infographic.tv we provide handpicked collection of the best infographics and data charts from around the world.


