Map Info & Chart : Local Spatial Autocorrelation of Life Expectancy in Continental US Counties [OC]
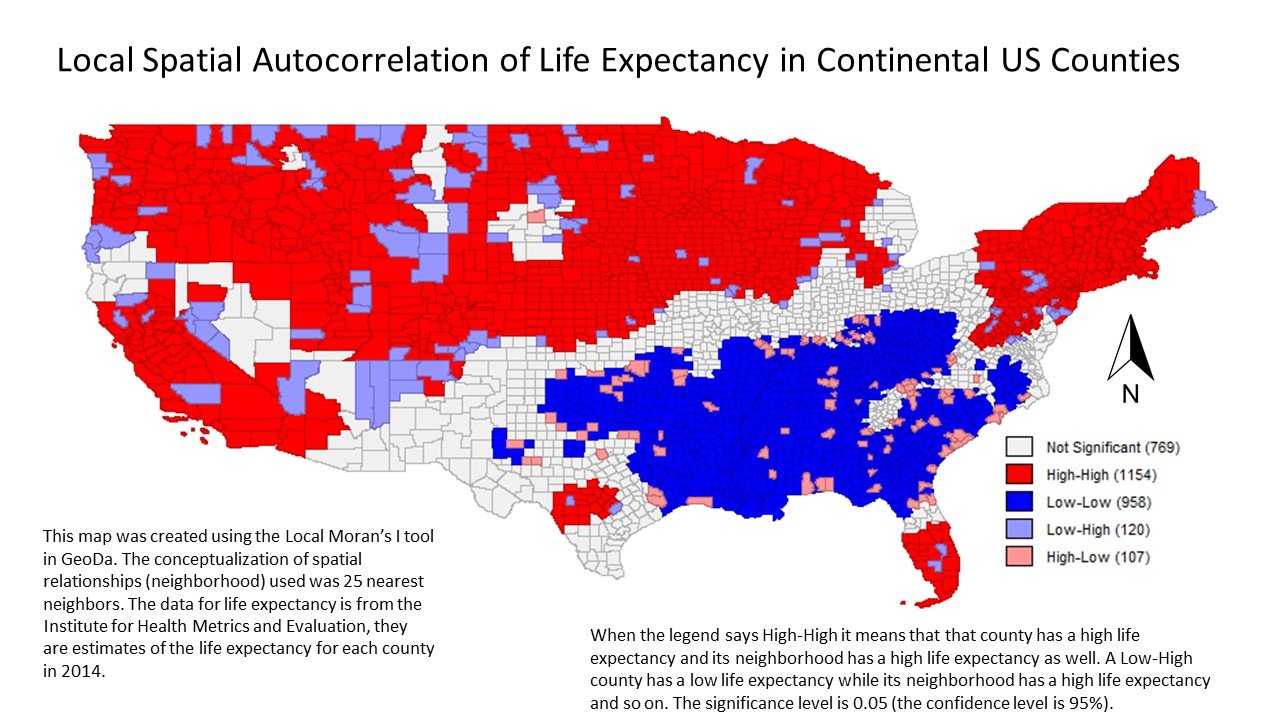
Local Spatial Autocorrelation of Life Expectancy in Continental US Counties [OC]
By GeoRiverRat
At infographic.tv we provide handpicked collection of the best infographics and data charts from around the world.