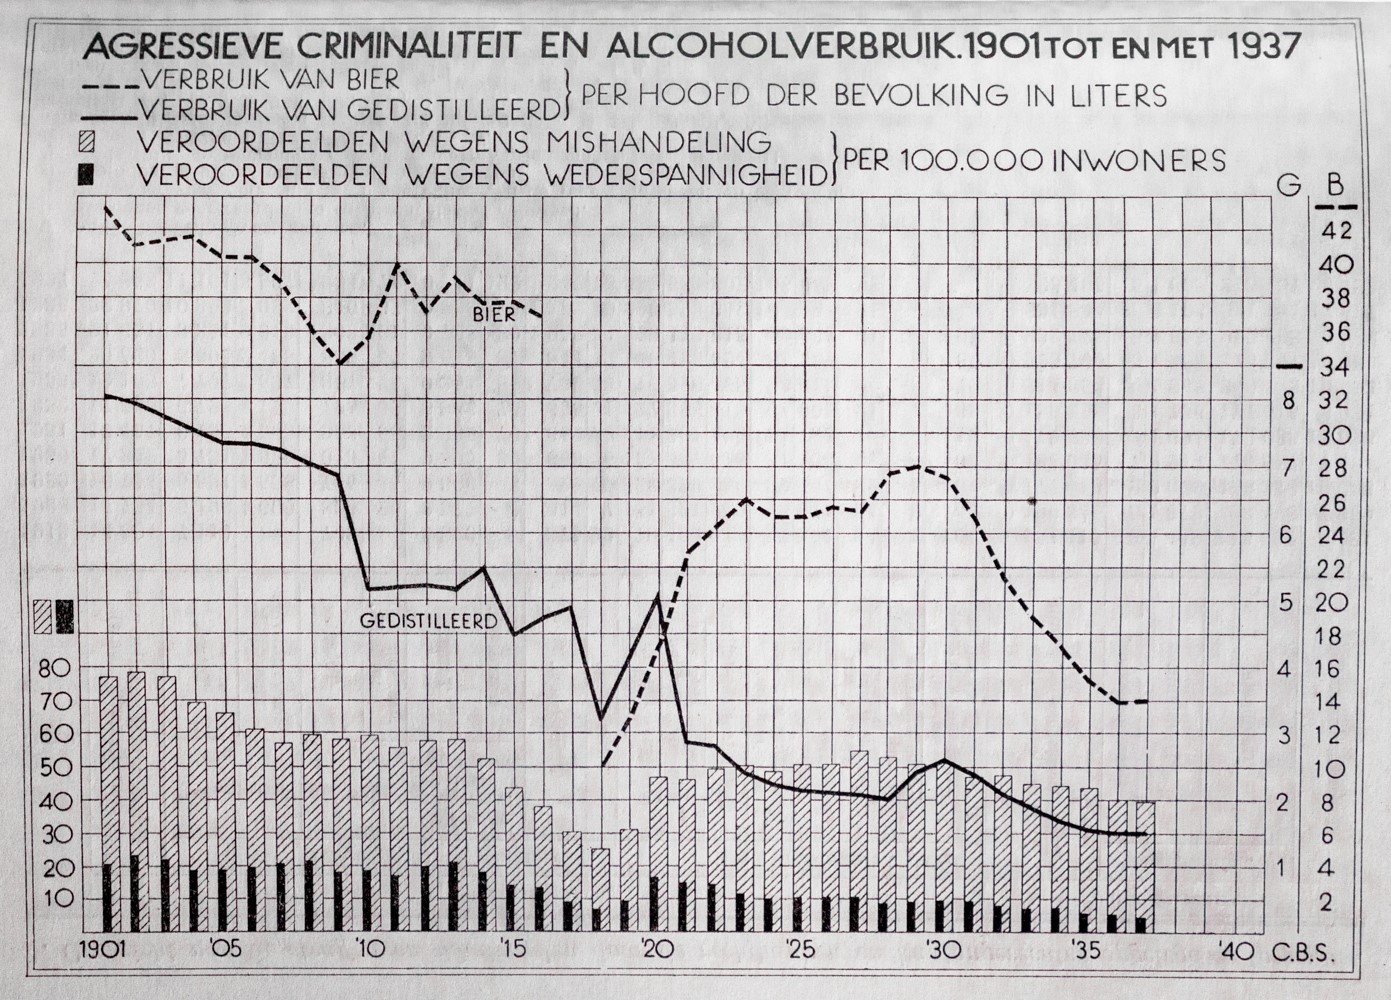
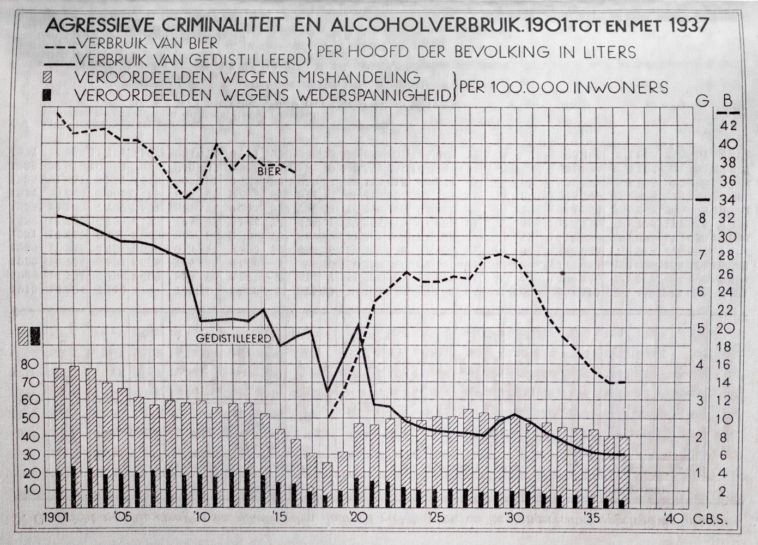
Data visualization : 1930s graph: aggressive criminality (bars) and alcohol usage (lines) from 1901 to 1937. Translation and info in comments

1930s graph: aggressive criminality (bars) and alcohol usage (lines) from 1901 to 1937. Translation and info in comments
By jumja
At infographic.tv we provide handpicked collection of the best infographics and data charts from around the world.


