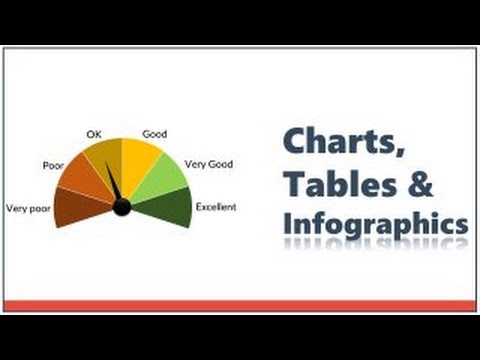
Video Infographic : PowerPoint Charts, Tables & Infographics Mastery Section
Video
Description
Visit:
Video from : Ramgopal’s PowerPoint Mastery Program.
Learn how to use PowerPoint to :
1) Makeover boring usual charts and graphs
2) Create interesting infographics
3) Make your data charts look like pictographs Fast.
4) Create Tables that rock with animations, interesting formats and more…
This PowerPoint Training covers not just the PowerPoint Tools but creative ideas and troubleshooting tips.


