in Infographics Data Chart : 38 Ecommerce Trends And Stats For 2017 (infographic) February 2, 2019, 4:06 am 16k Views 0 Comments Data Chart : 38 Ecommerce Trends And Stats For 2017 (infographic) 38 Ecommerce Trends And Stats For 2017 (infographic) Sharing is caring, don’t forget to share this infographic ! 0 shares What do you think? 459 Points Upvote Downvote Leave a Reply Cancel replyYour email address will not be published. Required fields are marked *Comment * Name * Email * Website Next post
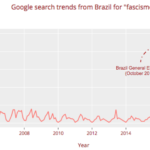
data visualization : [OC] The searches for “fascism” peaked coincidently at the time of the Brazilian general elections, October 2018.
")