in

Map : Nuclear America, 1979

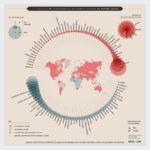
Map Info & Chart : Nuclear America, 1979

Nuclear America, 1979

By 290210748

At infographic.tv we provide handpicked collection of the best infographics and data charts from around the world.

  • Sharing is caring !
  • What do you think?

    459 points
    Upvote Downvote

    Leave a Reply

    Your email address will not be published. Required fields are marked *

    Loading…

    Visual : Who pollutes, and who suffers from pollution the most

    Map : Number of Military Occupations Conducted by each Country Since 1907 [OC][1632×1444]