Data visualization : [OC] Changing Poincaré section of a chaotic rotator at different phases
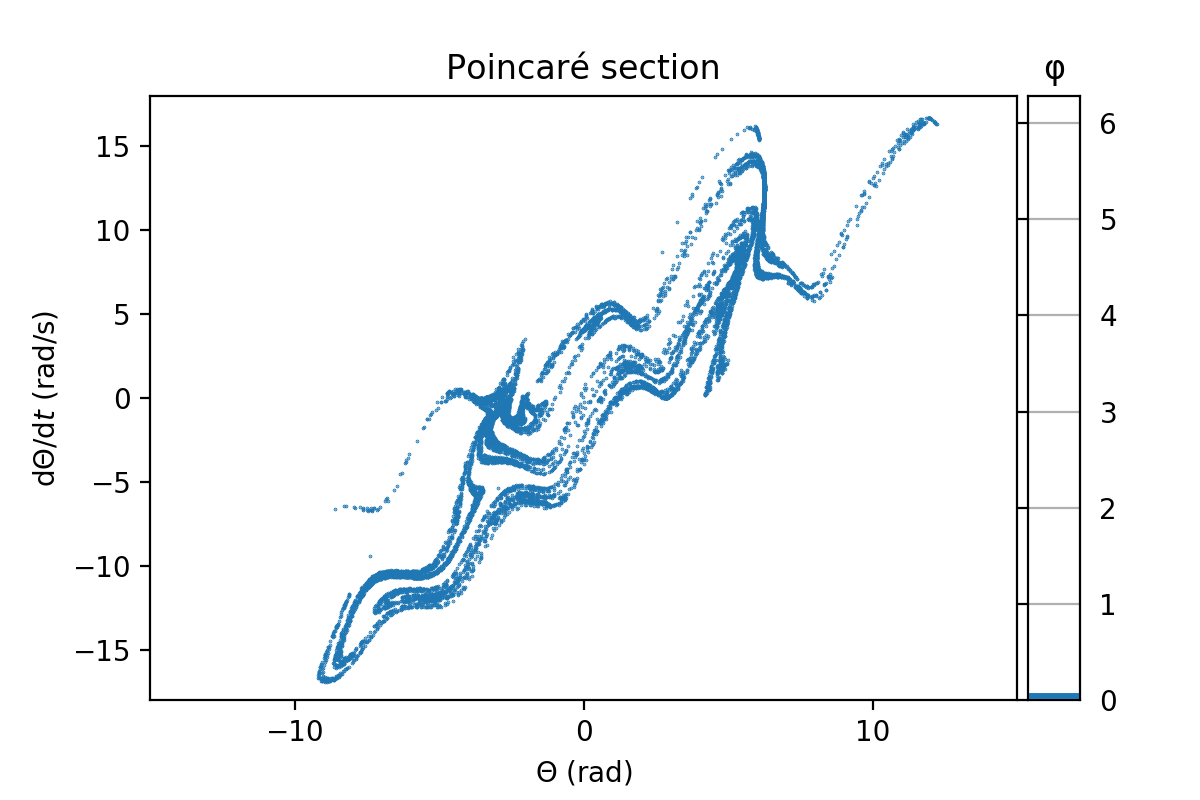
[OC] Changing Poincaré section of a chaotic rotator at different phases
By ThijsTaart
At infographic.tv we provide handpicked collection of the best infographics and data charts from around the world.