in

Data Chart : This Video Infographic Of Temperatures Rising Will Leave You Sweating [Infographic
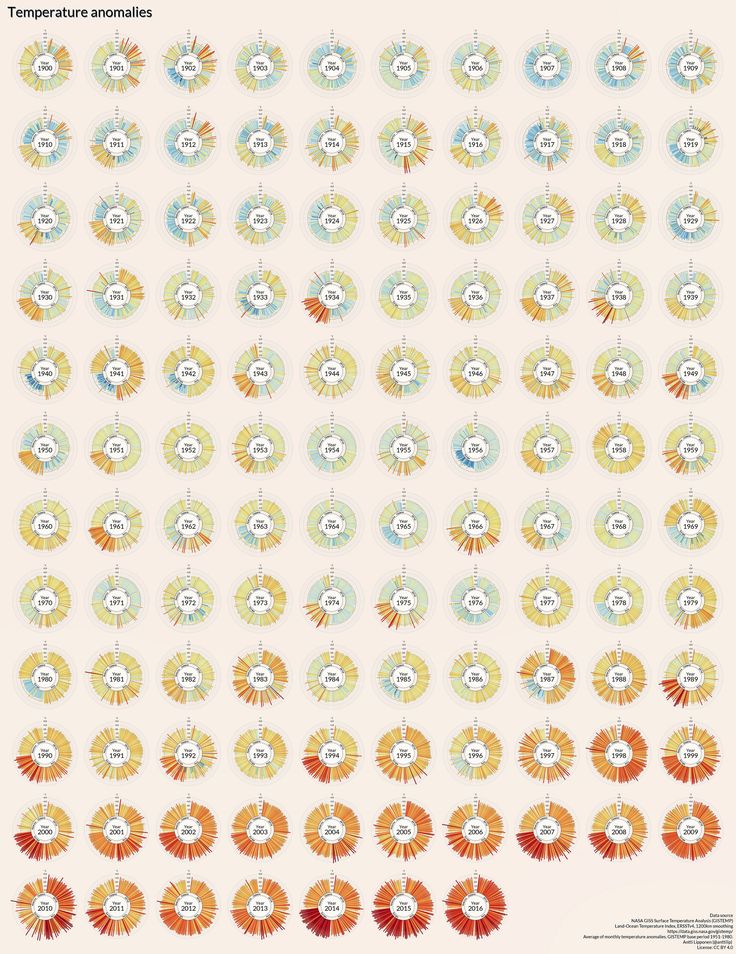
Data Chart : This Video Infographic Of Temperatures Rising Will Leave You Sweating [Infographic

Over a century of global temperatures pictured by country, gathered into a 35 second video #video#infographic#raisingglobaltemperature
  • Sharing is caring, don’t forget to share this infographic !

  • What do you think?

    459 points
    Upvote Downvote

    Leave a Reply

    Your email address will not be published. Required fields are marked *

    Loading…

    data visualization : Scatter graph of Exoplanetary data of the exoplanets with the smallest 389 periods. [OC]

    data visualization : Tom Clancy Novels, Before and After His Death [OC]