
Data visualization : Ridges Chart of Solar Panel Costs per Year
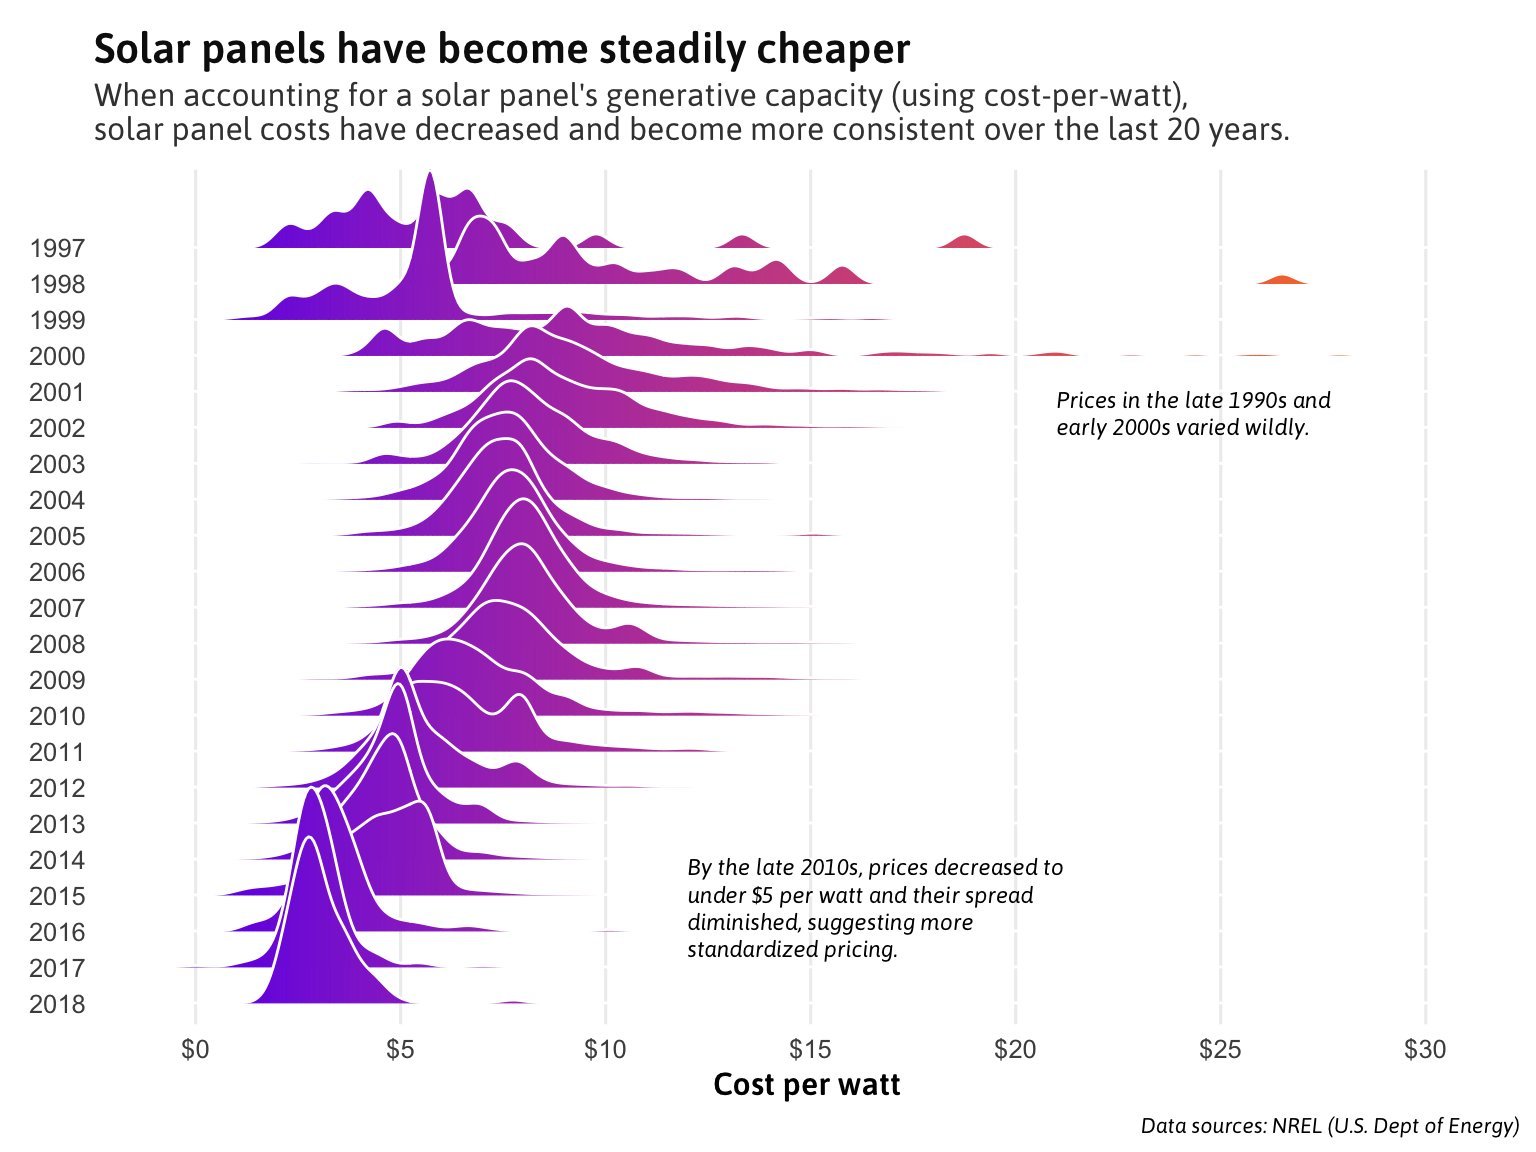
Ridges Chart of Solar Panel Costs per Year
By googoodoo
At infographic.tv we provide handpicked collection of the best infographics and data charts from around the world.


Here you'll find all collections you've created before.