in

data visualization : In the last 40 years in the NFL, 26 teams had a year-over-year increase of 7+ wins. These teams averaged a 3.5 win decrease the next season. Only 4 teams had the same or better record the year after the jump. [OC]

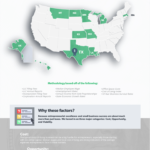
Data visualization : In the last 40 years in the NFL, 26 teams had a year-over-year increase of 7+ wins. These teams averaged a 3.5 win decrease the next season. Only 4 teams had the same or better record the year after the jump. [OC]

In the last 40 years in the NFL, 26 teams had a year-over-year increase of 7+ wins. These teams averaged a 3.5 win decrease the next season. Only 4 teams had the same or better record the year after the jump. [OC]

By JPAnalyst

At infographic.tv we provide handpicked collection of the best infographics and data charts from around the world.

  • Don’t forget to share the love !
  • What do you think?

    459 points
    Upvote Downvote

    Leave a Reply

    Your email address will not be published. Required fields are marked *

    Loading…

    Video Infographic : Create a Piktochart Infographic Easily – Basic Tutorial

    Infographic : Top U.S. States for Entrepreneurs & Small Businesses