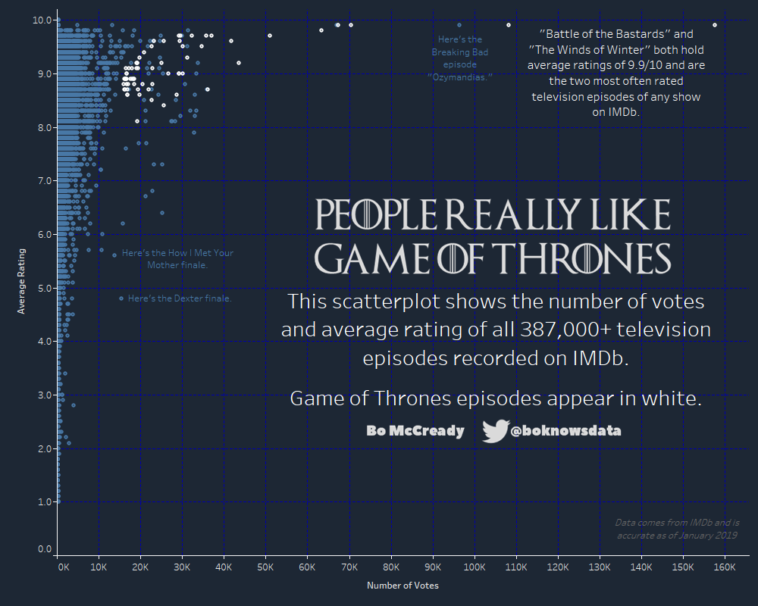
Data visualization : I made an interactive scatterplot of all 387,000+ television episodes with ratings on IMDb. Turns out people really like Game of Thrones. [OC]
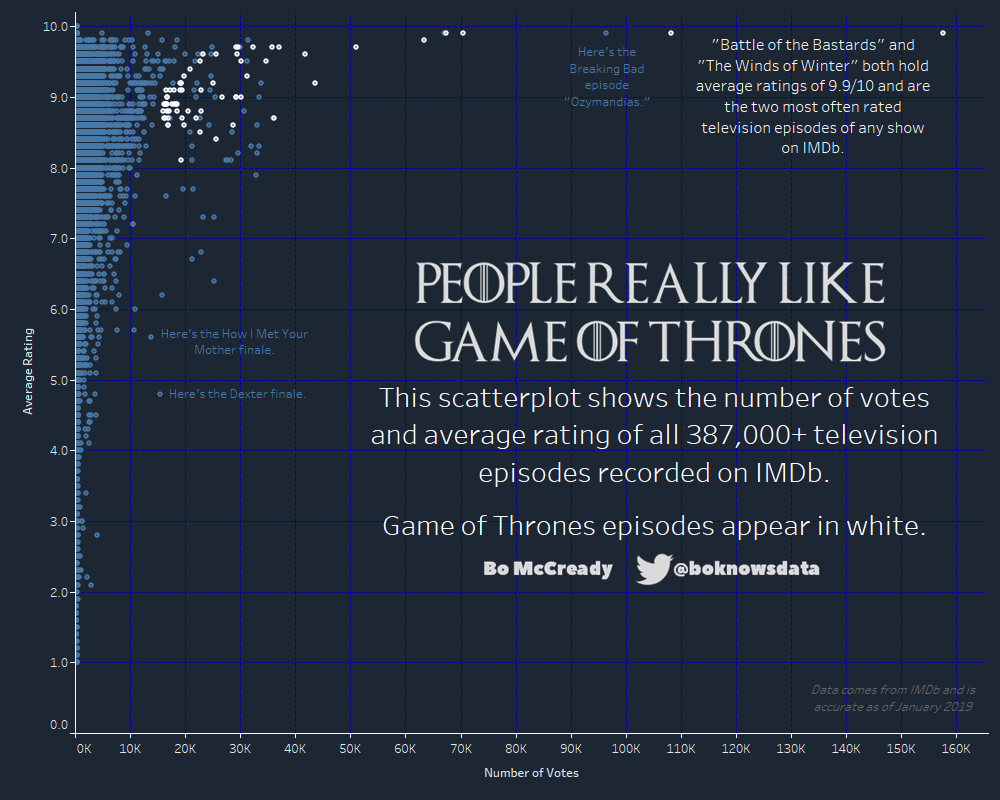
I made an interactive scatterplot of all 387,000+ television episodes with ratings on IMDb. Turns out people really like Game of Thrones. [OC]
By BoMcCready
At infographic.tv we provide handpicked collection of the best infographics and data charts from around the world.