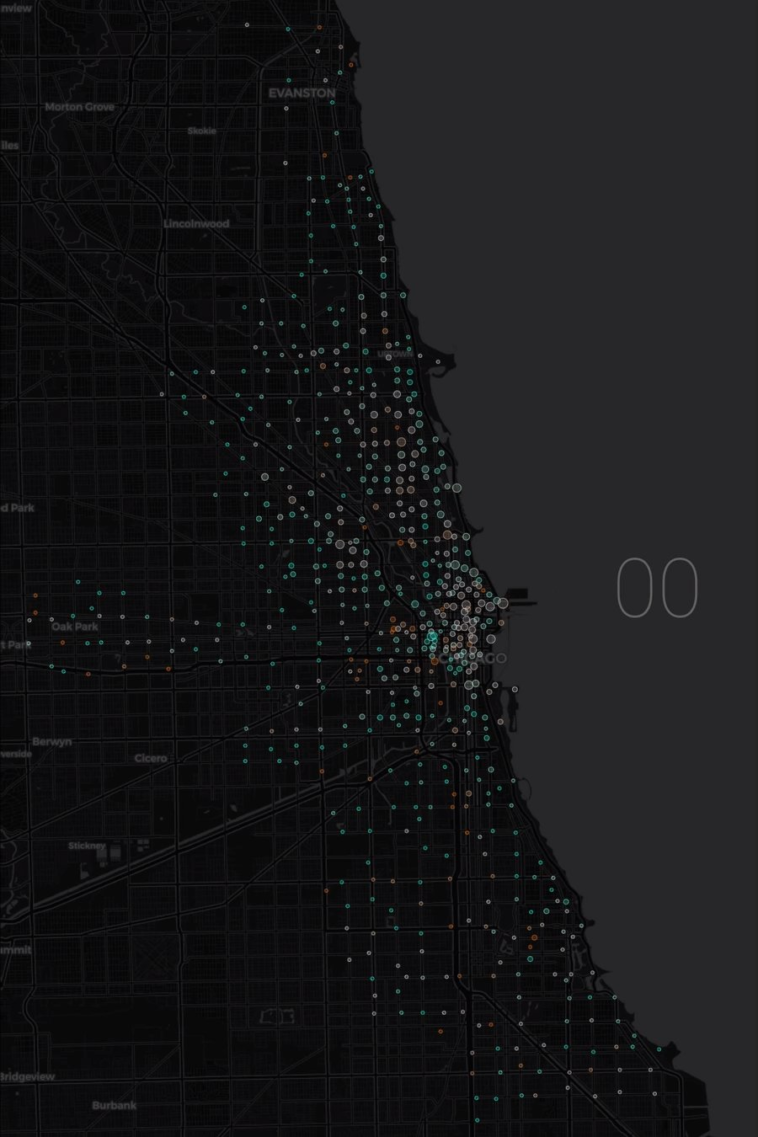
Data visualization : The ultimate day of Chicago bikeshare from 17 million rides. Orange stations for net departures. Blue stations for arrivals. Size represents station usage. [OC]
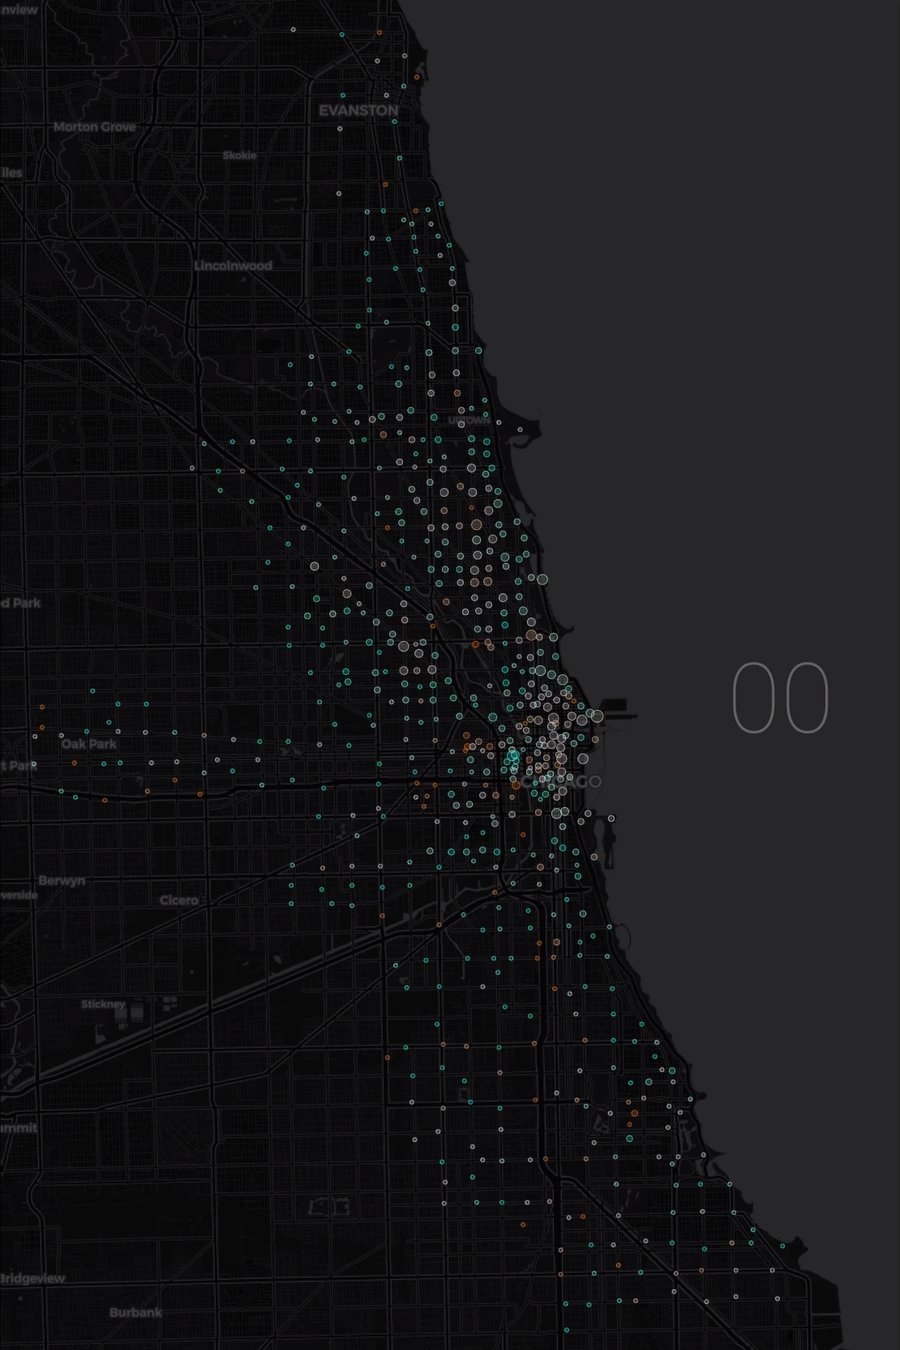
The ultimate day of Chicago bikeshare from 17 million rides. Orange stations for net departures. Blue stations for arrivals. Size represents station usage. [OC]
By clued__init__
At infographic.tv we provide handpicked collection of the best infographics and data charts from around the world.