Data visualization : 40 years (and 8,000 incidents) of nautical piracy, including detailed incident descriptions, by John Nelson
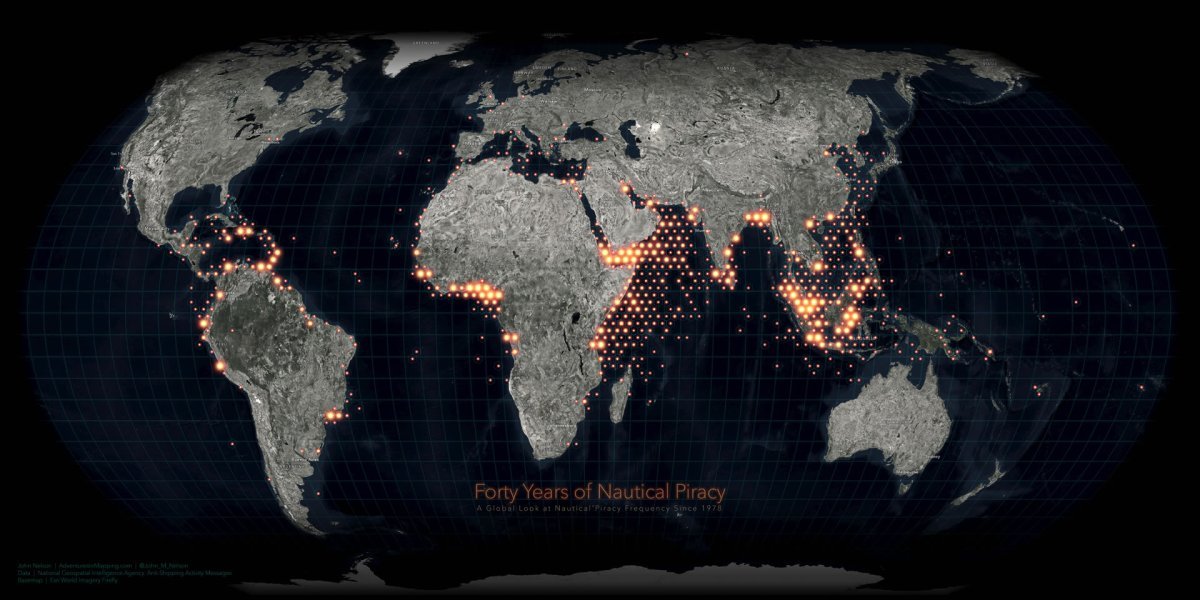
40 years (and 8,000 incidents) of nautical piracy, including detailed incident descriptions, by John Nelson
By Ambamja
At infographic.tv we provide handpicked collection of the best infographics and data charts from around the world.