in

data visualization : Townsville, Australia is currently enduring a “once in a century” flood. This graph shows the dam’s capacity (against it’s rated capacity) over 2018 and 2019…
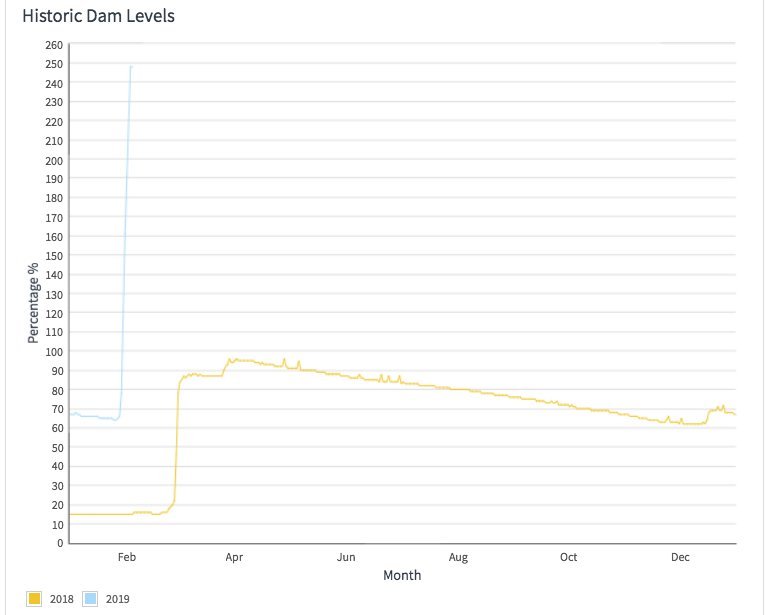
Data visualization : Townsville, Australia is currently enduring a “once in a century” flood. This graph shows the dam’s capacity (against it’s rated capacity) over 2018 and 2019…

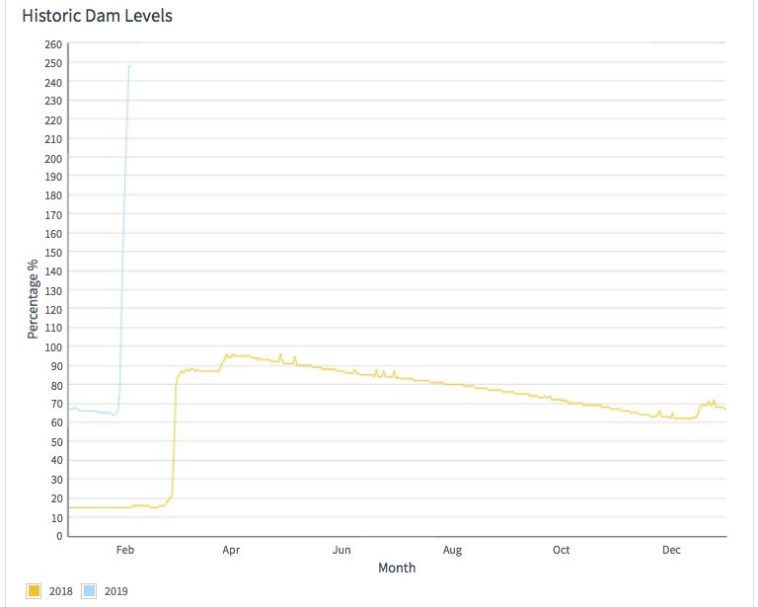
Townsville, Australia is currently enduring a “once in a century” flood. This graph shows the dam’s capacity (against it’s rated capacity) over 2018 and 2019…

By Frequenter

At infographic.tv we provide handpicked collection of the best infographics and data charts from around the world.

  • Don’t forget to share the love !
  • What do you think?

    459 points
    Upvote Downvote

    Leave a Reply

    Your email address will not be published. Required fields are marked *

    Loading…

    Video Infographic : coca cola infographic

    Data Chart : If You’re Pregnant, Stay Away From These Foods [Infographic