in

data visualization : A beautifully visualized map of music genres based on spotify data

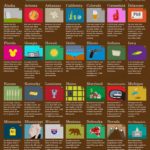
Data visualization : A beautifully visualized map of music genres based on spotify data

A beautifully visualized map of music genres based on spotify data

By Baduuuu

At infographic.tv we provide handpicked collection of the best infographics and data charts from around the world.

  • Don’t forget to share the love !
  • What do you think?

    459 points
    Upvote Downvote

    Leave a Reply

    Your email address will not be published. Required fields are marked *

    Loading…

    Data Chart : What Does Your State do Best? [Infographic

    Data Chart : The Barista’s Guide to Latte Art [Infographic