Data visualization : An analysis of the contents of top 500 posts on r/AccidentalRacism [OC]
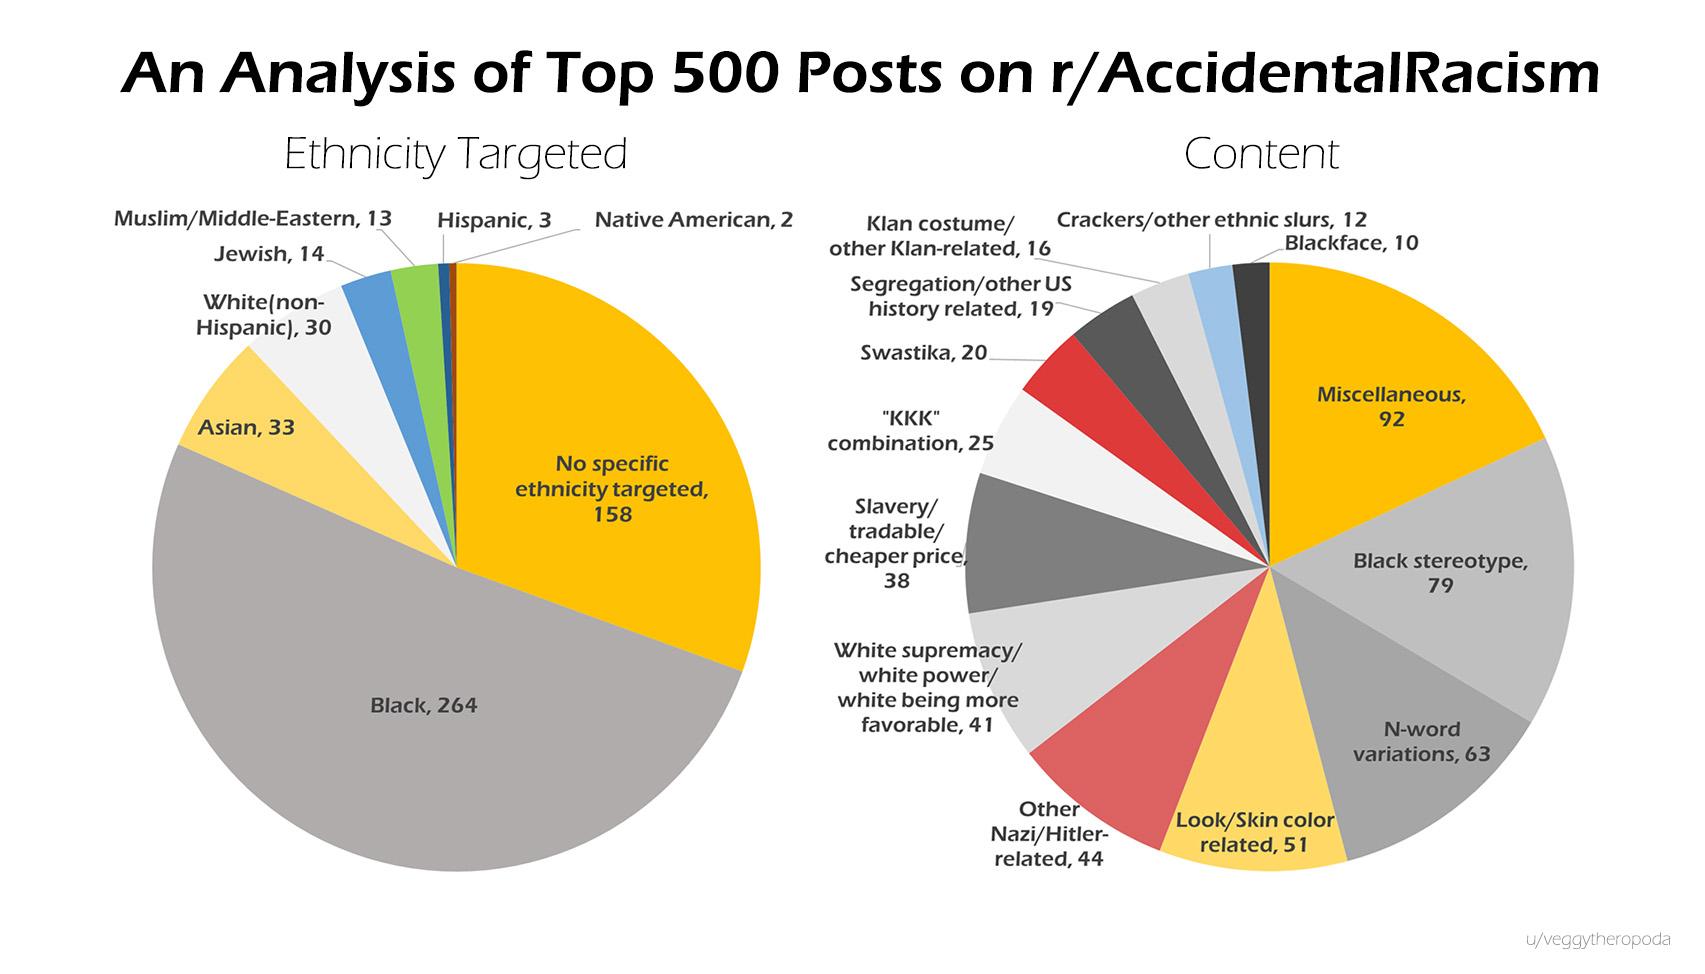
An analysis of the contents of top 500 posts on r/AccidentalRacism [OC]
By veggytheropoda
At infographic.tv we provide handpicked collection of the best infographics and data charts from around the world.