Data visualization : A decade of original (never-before-seen) answers that appear in the New York Times Crossword – 2008-2018 [OC]
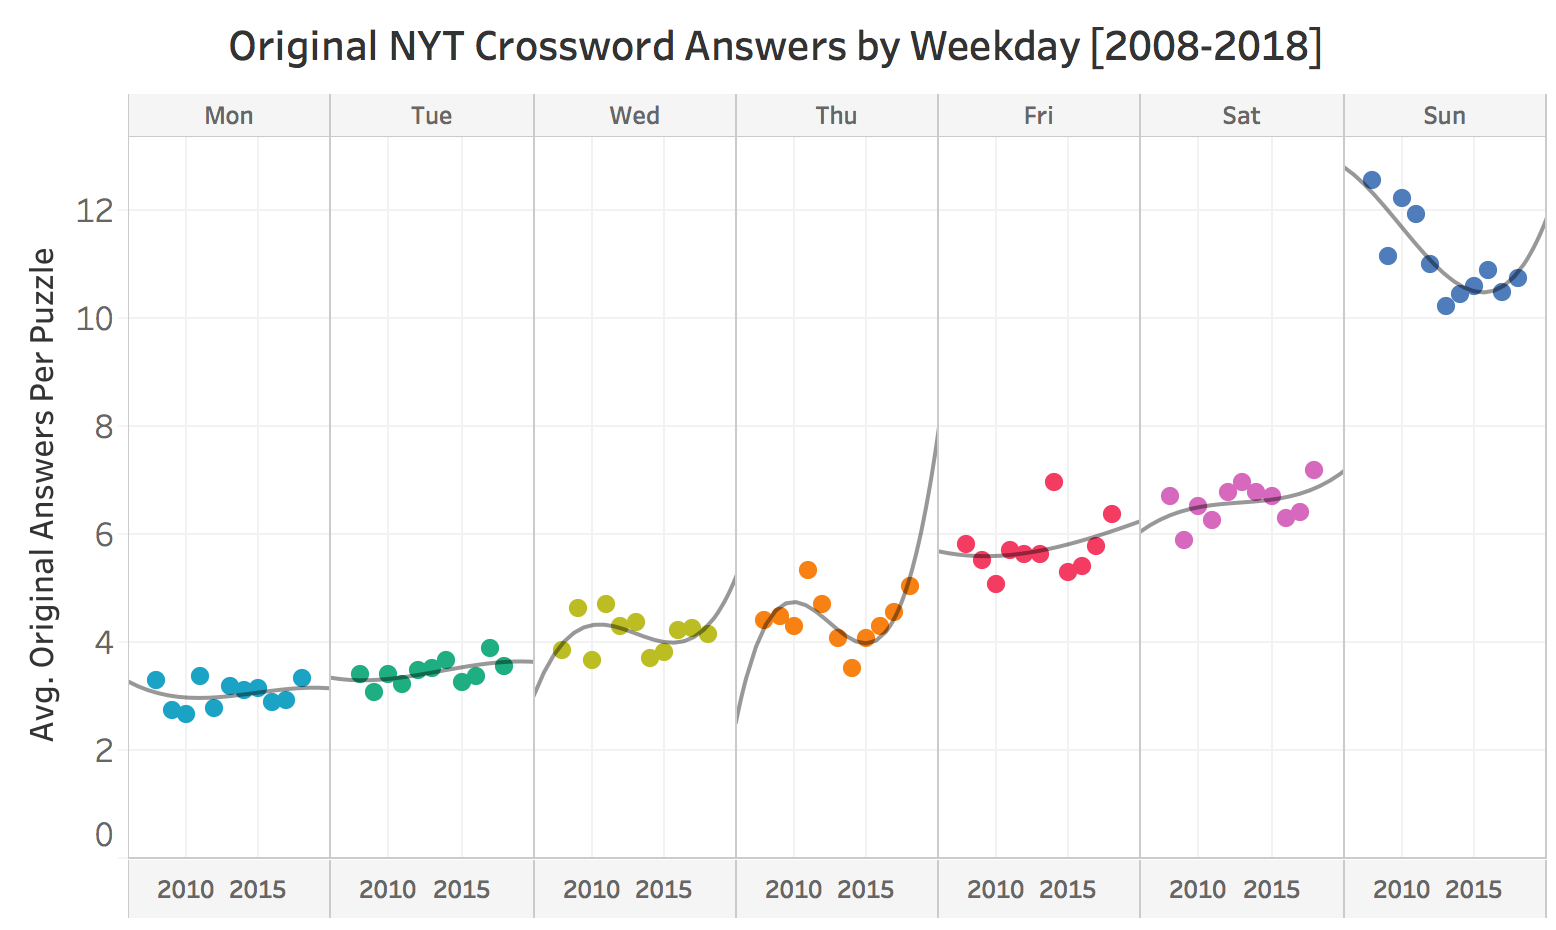
A decade of original (never-before-seen) answers that appear in the New York Times Crossword – 2008-2018 [OC]
By databoi_
At infographic.tv we provide handpicked collection of the best infographics and data charts from around the world.