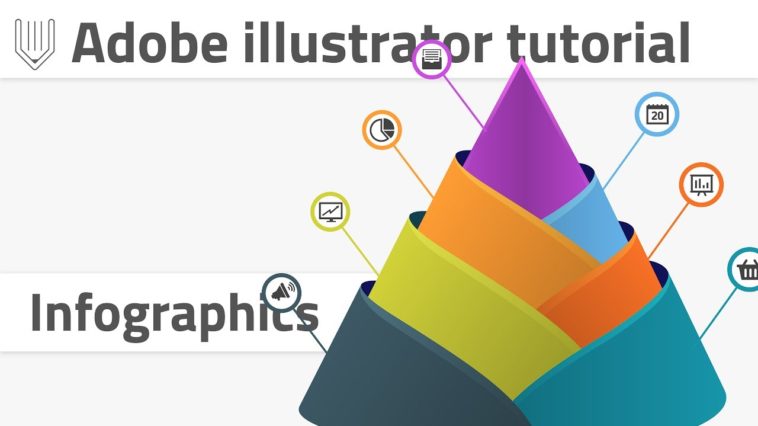
Video Infographic : How to create advanced infographics template | Adobe Illustrator tutorial
Video
Description
Hi, everybody. Today we are going to create some more infographic templates in Adobe Illustrator from scratch!.
We’ll learn an awesome technique of mapping object on 3d shape surface in order to create meaningful design and hierarchy.
Let’s get started.
CONTENT :
1. Introduction:
2. New document and preparation :
3. Create a symbol :
4. Create 2d object :
5. Create 3d object and map symbol :
6. Expand and recolor objects :
7. Create final infographic template :
New document
Start with 1920x1080px document. Turn off “align to pixel grid”.
Create a symbol
Create 1250x200px ellipse. Align it both horizontally and vertically to the center. Set any fill color and stroke color to none.
Create horizontal line wider then 1250px. Align it to the center as well. Select both the ellipse and the line and navigate to shpe builder tool.
With shape builder tool slice 1/2 of the ellipse. Leave only top half and delete unnecesery staff around.
Drag this top part to the symbols panel in order to create a symbol. In opened dialog box change import type to “Graphic” and click ok. delete original shape.
Read more here :
🎓🎓🎓 SEVEN MORE infographic tutorials ! 🎓🎓🎓
🚀🚀🚀 Subcribe and master Adobe Illustrator with Vitorials.net! 🚀🚀🚀
Subcribe to my chanell for daily content !
Subcribe to my newslatter :


