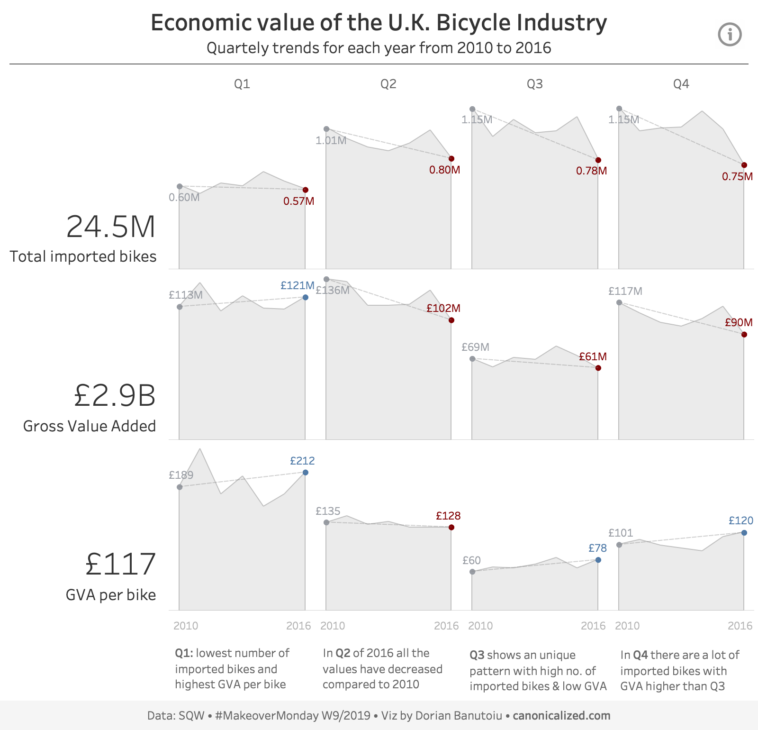
Data visualization : Economic value of the U.K. Bicycle industry: Quarterly trends for each year using “cycle slope” plots [OC]
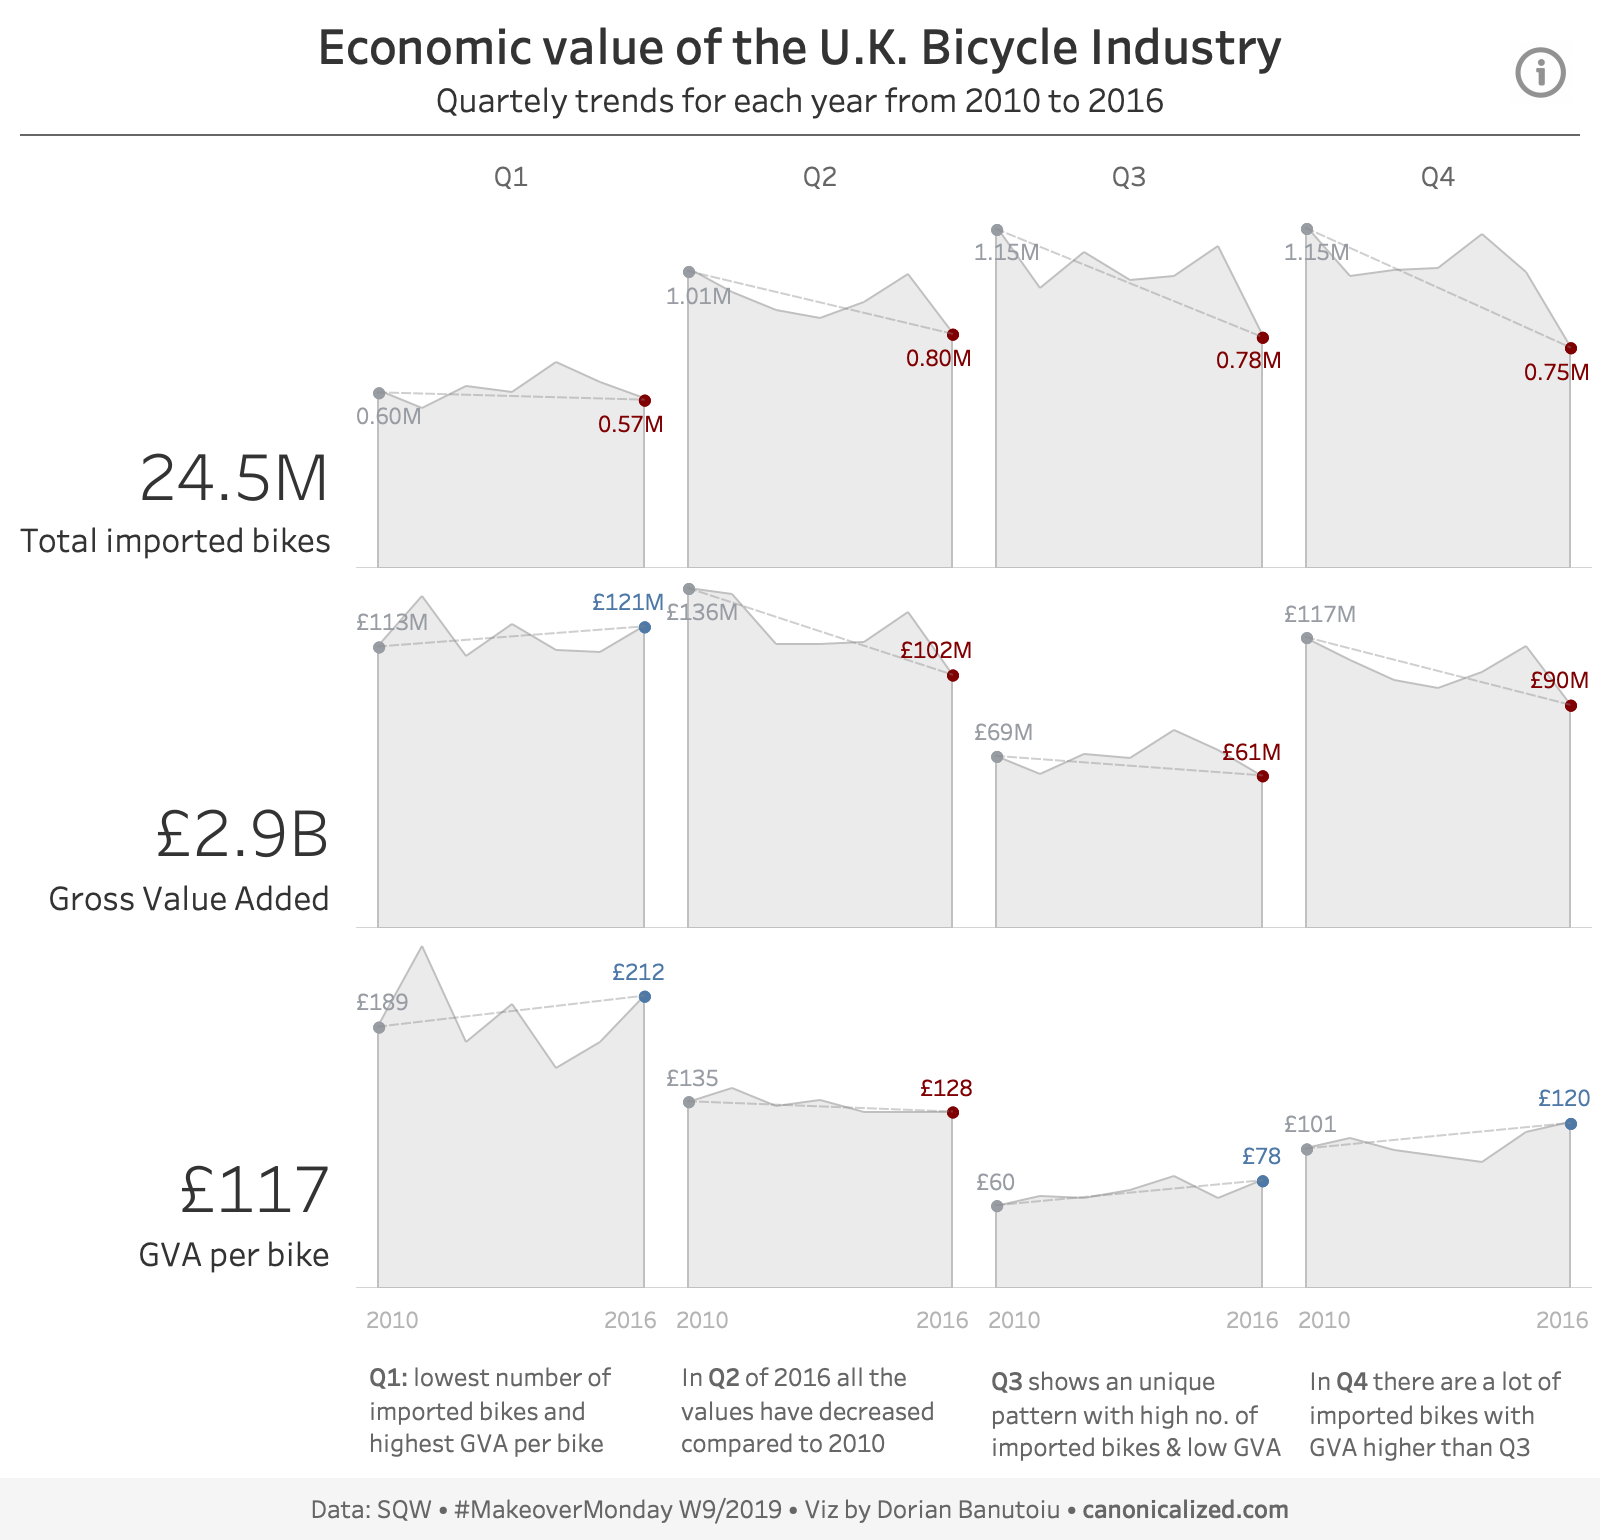
Economic value of the U.K. Bicycle industry: Quarterly trends for each year using “cycle slope” plots [OC]
By canonicalized
At infographic.tv we provide handpicked collection of the best infographics and data charts from around the world.