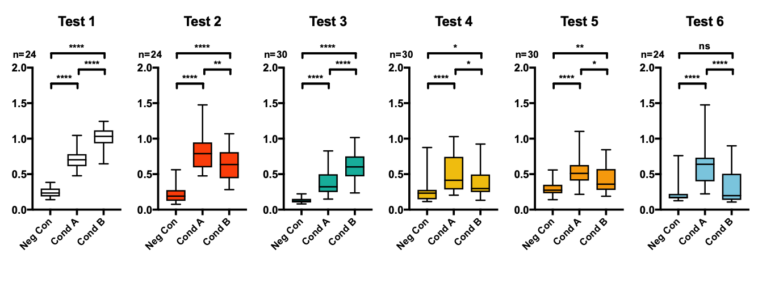
Data visualization : [OC] I have lots of small individual ANOVA comparisons that I am analyzing for broad trends. How can I display my data without it being overwhelming?
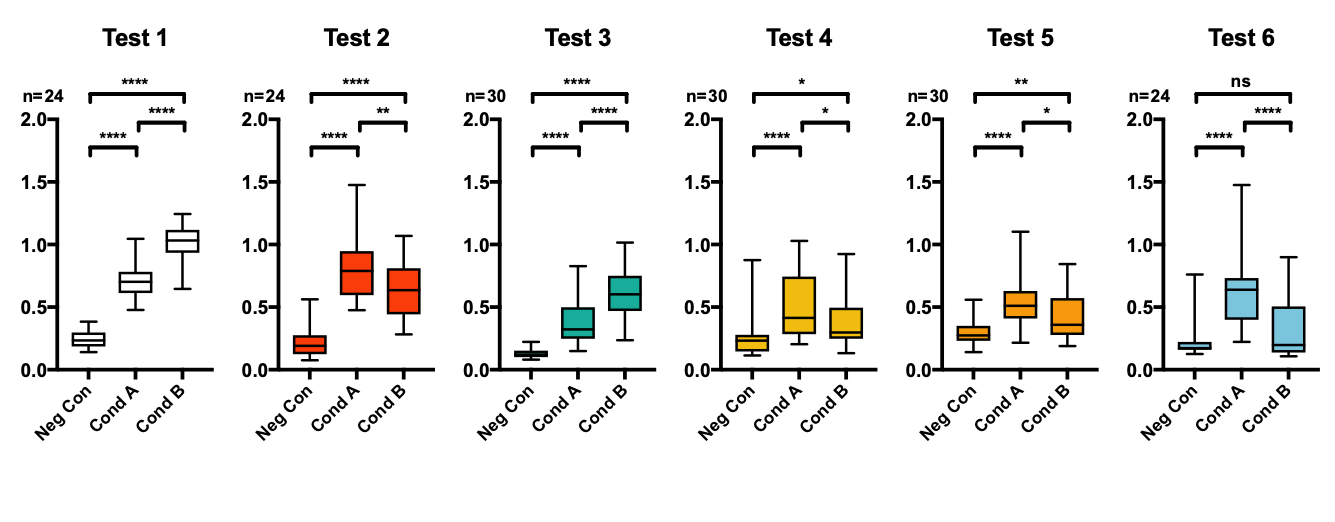
[OC] I have lots of small individual ANOVA comparisons that I am analyzing for broad trends. How can I display my data without it being overwhelming?
By beowolfey
At infographic.tv we provide handpicked collection of the best infographics and data charts from around the world.