
Map Info & Chart : Agriculture, value added (% of GDP) (Europe)
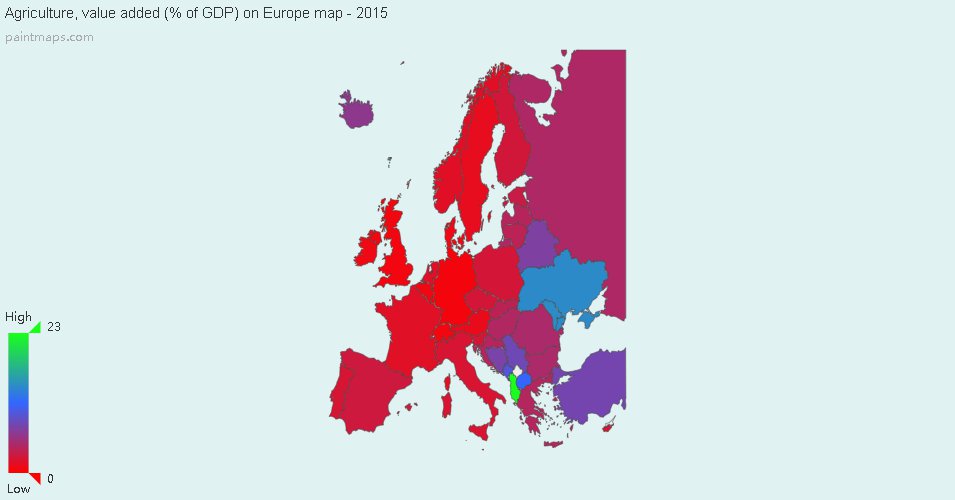
Agriculture, value added (% of GDP) (Europe)
By ytkn55
At infographic.tv we provide handpicked collection of the best infographics and data charts from around the world.

Here you'll find all collections you've created before.