Infographic : Talk slides: The State of the Union 2019+
Over the past few weeks I’ve had the opportunity to work on and present a talk titled ‘Data Visualisation: The State of the Union, 2019 and beyond”. My attempt to curate a wide range of observations about the state of data visualisation now, and the trends and potential trajectory of the subject going forward, as we enter a new decade. It is impossible to be truly comprehensive and cover all matters associated with this broad and fast-moving field, but I hope this represents a useful conversation starter.
Today I delivered this talk, like a true hero through the fog of a heavy cold, for a Tableau webinar which represents the final occasion I will do this particular talk.
The slides are now available, published on SlideShare, and can be viewed below. Note that due to the amount of detailed images included in this deck some of the resolution quality has been compromised during the uploading process. If you want to watch the recording of the webinar, you can access this here. You can also download a pdf copy of the slides instead.
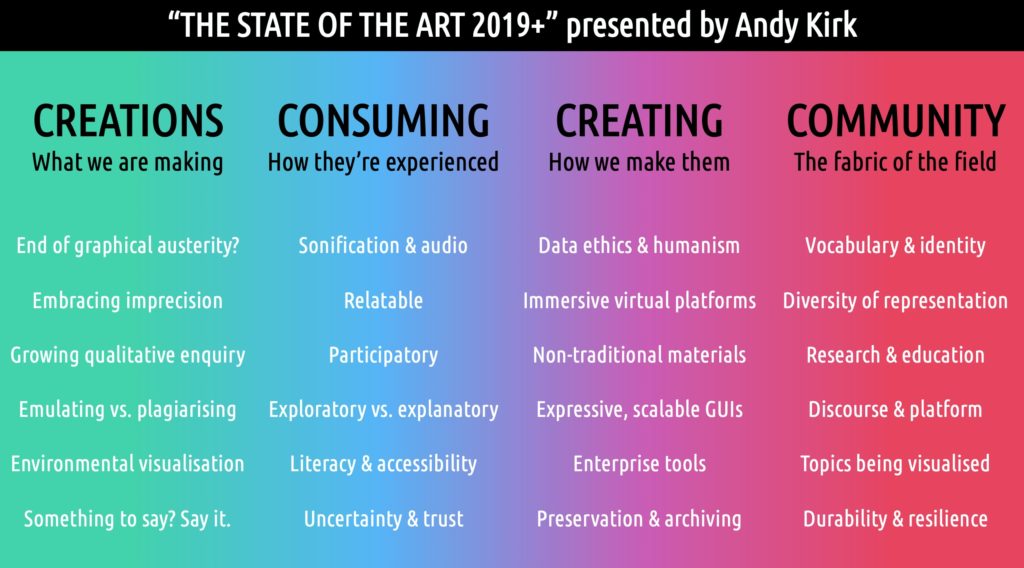
For a convenient summary of the observations made, here are the key topics discussed, organised across four main themes:

Finally, a huge thanks to the following contributors with whose help the contents of this presentation were shaped:


