Infographic : Sneak preview: ‘The Seinfeld Chronicles’
A couple of years ago I embarked on a passion project to visualise Seinfeld, with the ambition of creating a large, detailed printed product to explore the rhythm and architecture of how this show was composed.
With 180 episodes aired across nine seasons, there had to be some interesting patterns to expose the thinking behind the writing and production: I wanted to analyse every episode to see, in data form, the structure of scenes, how the characters were used and when, to learn about the locations, and to discover who got the laughs. Everything but the script, essentially.
The manual data gathering, achieved by logging events through watching the shows on DVD, was intensive but rich in the potential and novelty of its yields. Frustratingly, I’ve rarely had a sufficient block of time since to build up the necessary momentum to fully translate this data into a final piece of work. As a non-client project it has been a significant undertaking but one that quickly gets shoved lower down the priority list when other commitments emerge.
At the start of the year I was well placed to look at a publishing target of late April. Then, as you might have heard, a global pandemic struck. This caused mass disruption to my workload, to my upcoming commitments and, frankly, to my immediate commercial prospects. Passion projects had to be put on ice in favour of quickly pivoting to find new business channels that would help me adapt to the new surroundings. It also meant that other stakeholders involved in this task would also be affected, including the local printers with whom I planned to produce the final outputs going on temporary furlough.
Anyway, I know many of you have been hearing me going on about this project for a *long* time now and you’ll be tired of me claiming ‘coming soon…’ only for nothing to happen. Well, it is now genuinely coming soon… just not quite yet!
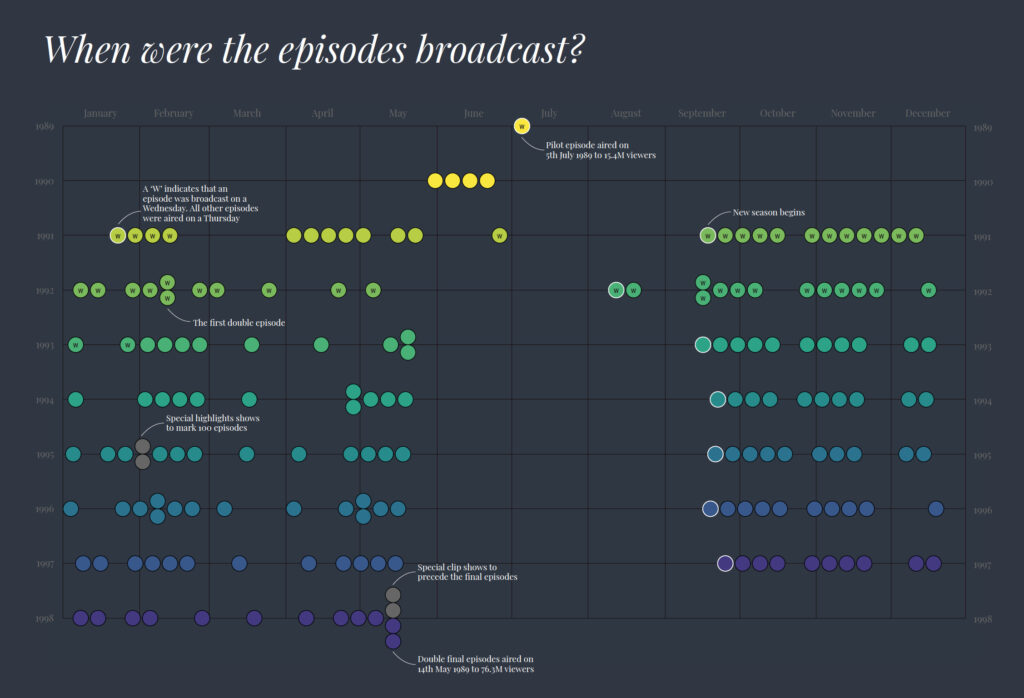
I have belatedly learnt over the years that launching new things during summer months is generally less favourable than almost every other point in the year. This is something that stands out in the analysis of the Seinfeld episode airing dates. Aside from a few in the early days, as it was finding its feet and waiting for its chance to occupy NBC’s prime comedy schedule (ie. waiting for ‘Cheers’ to end), summer-time episodes were a big no-no.

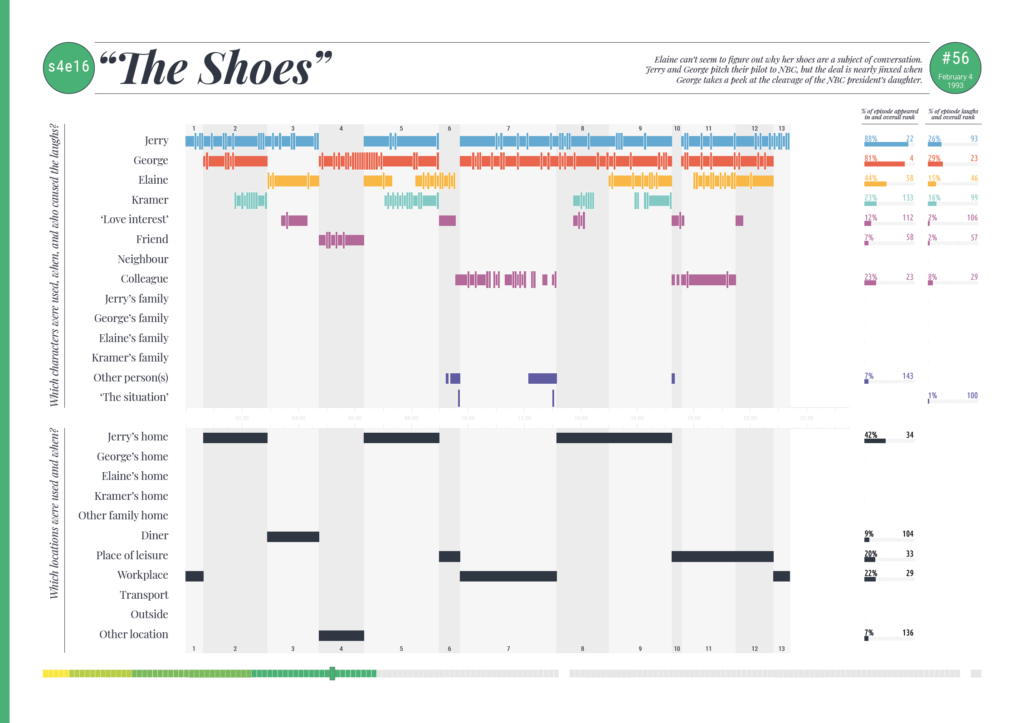
So, I am waiting until September, my birthday month and the time of year I always associate with new beginnings (new school year, new university year, new football seasons). When it does land it will be as a printed output, a ~240 page glossy report/book. There will be different sections of analysis and commentary focusing on different themes, with the main contents comprising full-page visual portrayals of each episode, like the example below.

My intention is to print a limited number of copies and then make these available for people to buy on a ‘pay what you like’ basis. I am still to finalise the mechanics of this but my idea is to use theses funds to ONLY cover the cost associated with posting and packaging for each individual order. All remaining monies will then be donated to a charitable cause. I haven’t selected one yet but it will be relevant to the times in which we now live.
If you would like to add your name to a no-obligation-to-buy reserve list, giving you early and first refusal to potentially buy a copy of this work, please just email me andy@visualisingdata.com.


