Infographic : visualcomplexity.com | Brain drain
 |
 |
| The materials shown on this page are copyright protected by their authors and/or respective institutions. |
|
Brain drain |
|
| Author(s): Giorgia Lupi, Simone Quadri, Gabriele Rossi, Davide Ciuffi, Federica Fragapane, Francesco Majno |
|
| Institution: Accurat |
|
| Year: 2013 |
|
| URL: http://www.brainpickings.org/2013/02/13/giorgia-lupi-brain-drain/ |
|
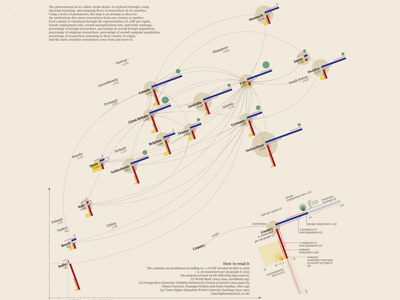
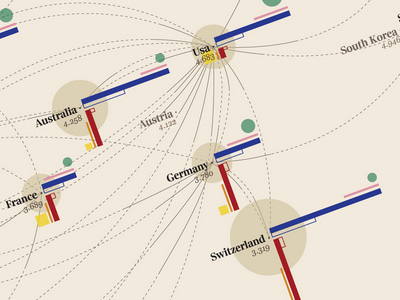
| Project Description: Giorgia Lupi and her team at Accurat have developed a visualization, originally for Italian newspaper La Lettura, to explore the phenomenon of “brain drain”. They combined survey data from the World Bank, results from a research paper on scientist mobility patterns, and The Times’ ranking of the world’s best universities to compare the number of researchers with the percentage of GDB devoted to science funding. They also depicted various other economic parameters. Here, edges represent migration from one country to another. Lupi was apparently inspired by a visit to MoMA’s Inventing Abstraction to incorporate the parameters of the countries as a complex compound element, and wanted to recreate the same abstract geometric aesthetic. |
|
|
|
|
|
|
|
|
Comments (0): |
|
| *Note* Before you submit your comment, bear in mind there’s no guarantee it will be seen by this project’s author. In case you want to contact the author directly, please follow the provided URL. | |
| Leave a Comment: | |
|
* COMMENTS HAVE BEEN TEMPORARILY DISABLED * (We’re looking for the best solution to avoid unwanted SPAM) |
|


