Data visualization : The world’s economic centre of gravity from 1AD to 2025, using an average of countries’ locations weighted by their GDP.
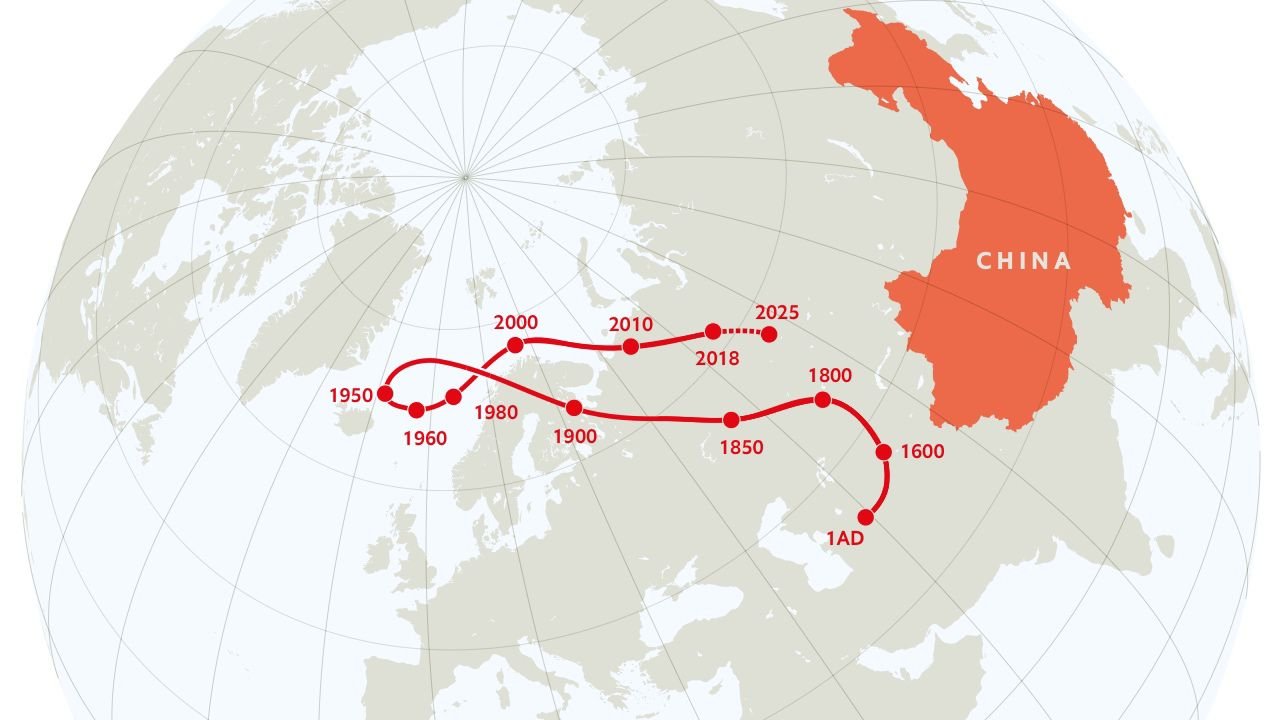
The world’s economic centre of gravity from 1AD to 2025, using an average of countries’ locations weighted by their GDP.
By Sea_Tee
At infographic.tv we provide handpicked collection of the best infographics and data charts from around the world.