in

Video Infographic : Saipem in Numbers – Infographic 2014

Video Infographic : Saipem in Numbers – Infographic 2014

Video

Description

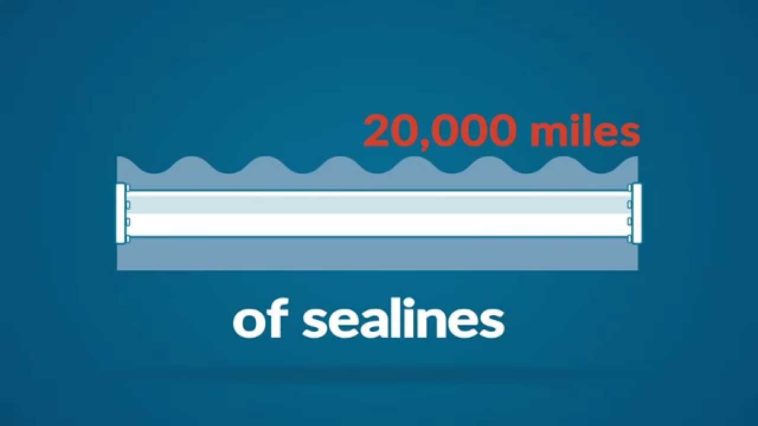
60 years of Saipem in the oil and gas industry summed up in 90 seconds. 5 continents, more than 60 countries and thousands of onshore pipelines and offshore sealines.
Take a look at our numbers and find out more about our track records: www.saipem.com

  • Don’t forget to share this video with your friends !
  • What do you think?

    459 points
    Upvote Downvote

    Leave a Reply

    Your email address will not be published. Required fields are marked *

    Loading…

    Video Infographic : Is There Evidence That Aliens Did Come To Roswell?

    Map : Median income in PPS units 2017 (Eurostat)