Data visualization : The number of deaths as a result of police conduct in England and Wales for 2017/2018 by ethnicity. [OC]
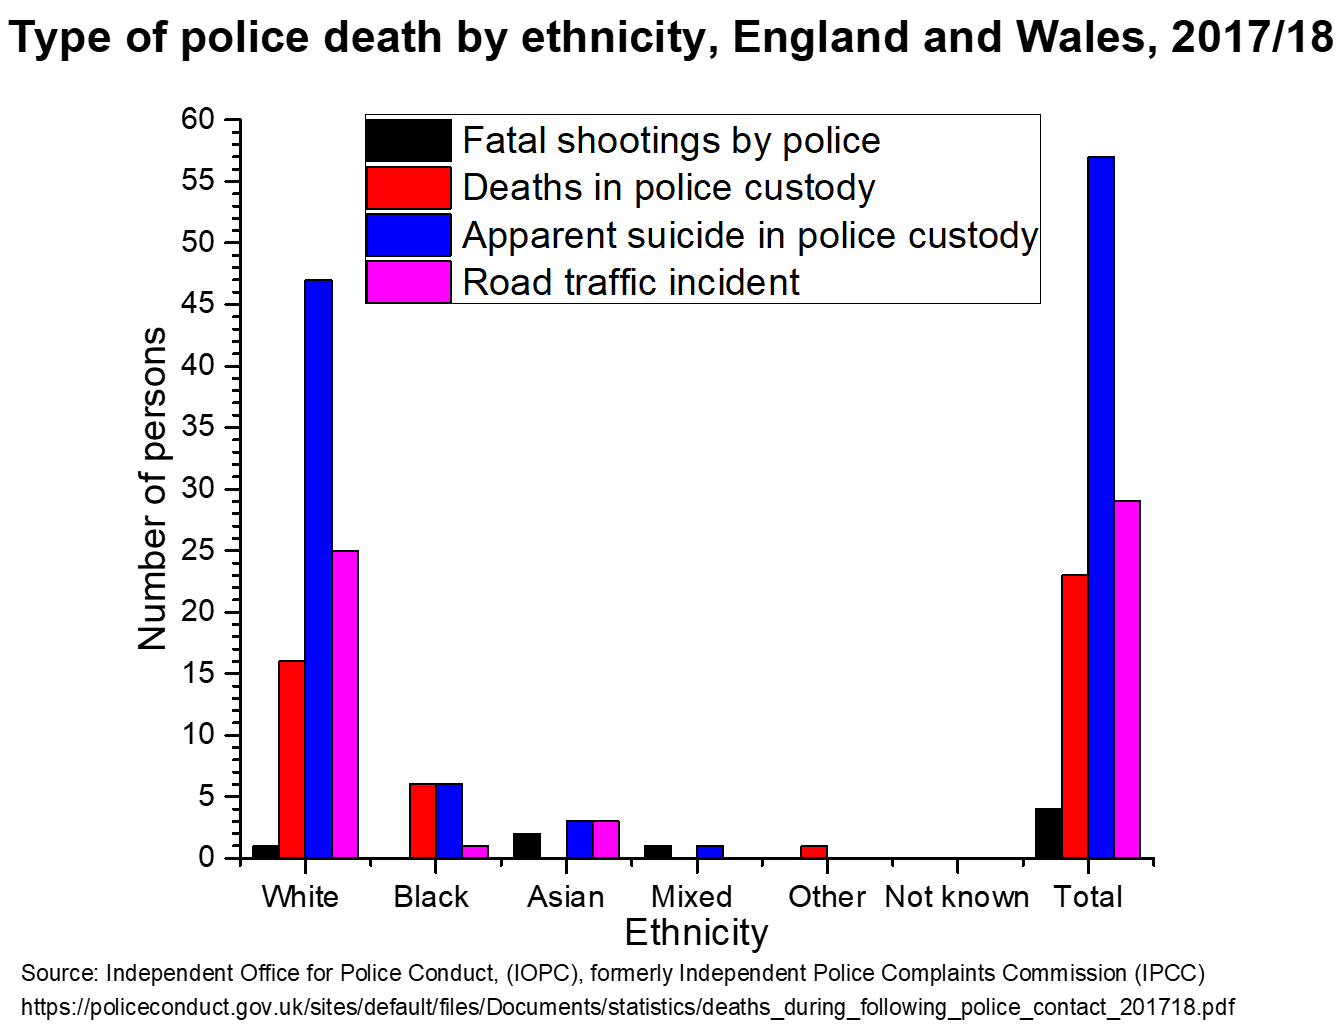
The number of deaths as a result of police conduct in England and Wales for 2017/2018 by ethnicity. [OC]
By Undercover5051
At infographic.tv we provide handpicked collection of the best infographics and data charts from around the world.