in

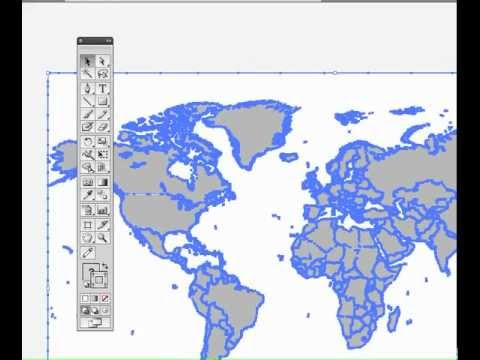
Video Infographic : Creating maps for infographics 101- Part 1 of 3

Video Infographic : Creating maps for infographics 101- Part 1 of 3

Video

Description

Part 1 of 3. A tutorial that introduces how SVG maps can be incorporated into infographic projects Adobe Illustrator. We’ll examine free online resources like Wikimedia commons. Case studies from the MikeWirthArt.com portfolio are explored as examples.

  • Don’t forget to share this video with your friends !
  • What do you think?

    459 points
    Upvote Downvote

    Leave a Reply

    Your email address will not be published. Required fields are marked *

    Loading…

    Video Infographic : Illegal Things That YOU Do Every Day

    Data Chart : Top 10 Ways To Start A Fire [Infographic