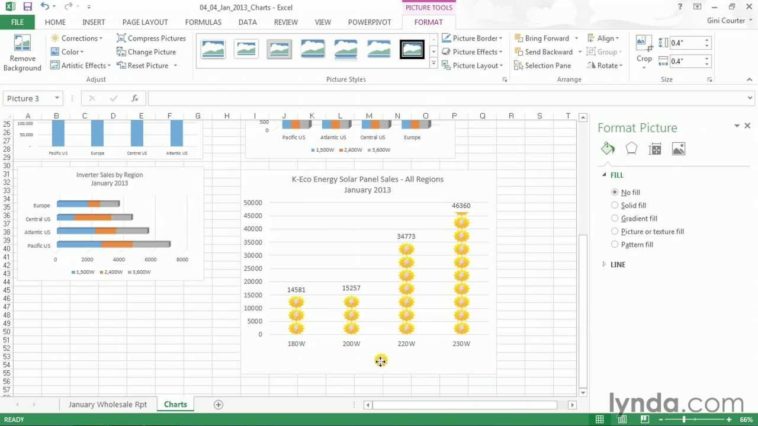
Video Infographic : Excel tutorial: Building an infographic using a picture fill | lynda.com
Video
Description
Infographics, or information graphics, are visual representations of data designed to present complex information in an easy-to-understand form. In this tutorial, learn how to leverage the power of charts in Excel to build an infographic, using a picture fill. Watch more at
This tutorial is a single movie from the Data-Driven Presentations with Excel and PowerPoint course presented by lynda.com author Gini Courter. The complete course is 3 hours and 46 minutes and shows how to drive your PowerPoint presentations with Excel data.
Introduction
1. Data-Driven Presentations: The Basics
2. Formatting Excel Tables for Presentations
3. Highlighting Data with Conditional Formatting
4. Using Charts to Illustrate Data
5. Summarizing with PivotTables and PivotCharts
6. Taking Excel to PowerPoint
7. Using SmartArt in Data-Driven Presentations
8. Animating Charts and Data
9. Finalizing Your Presentation
Conclusion


