Data visualization : See all Asian ethnicities mapped by state and county. Hover over map for number, margin of error, and population estimates. [OC] Made in Tableau using American Community Survey 2017, 5-year estimates from https://factfinder.census.gov/
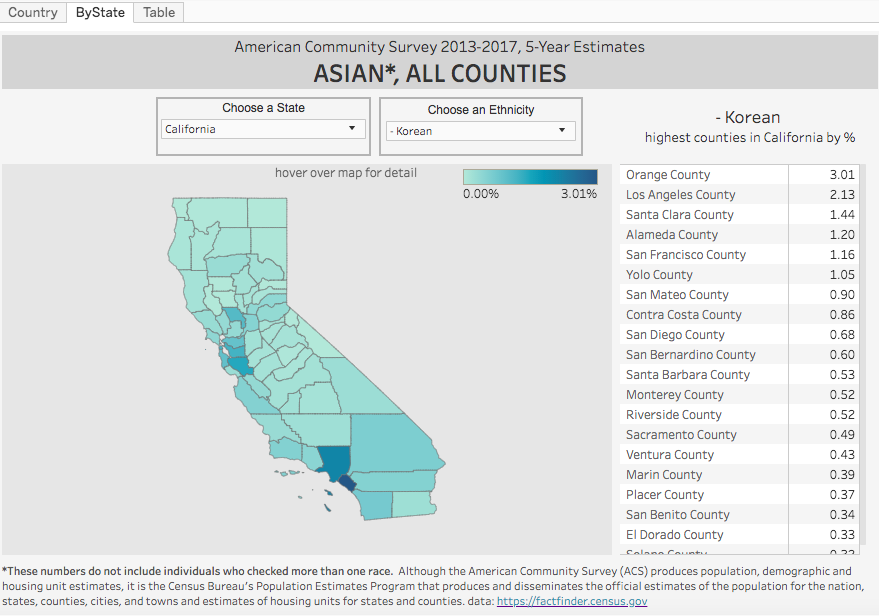
See all Asian ethnicities mapped by state and county. Hover over map for number, margin of error, and population estimates. [OC] Made in Tableau using American Community Survey 2017, 5-year estimates from https://factfinder.census.gov/
By ldorazio
At infographic.tv we provide handpicked collection of the best infographics and data charts from around the world.