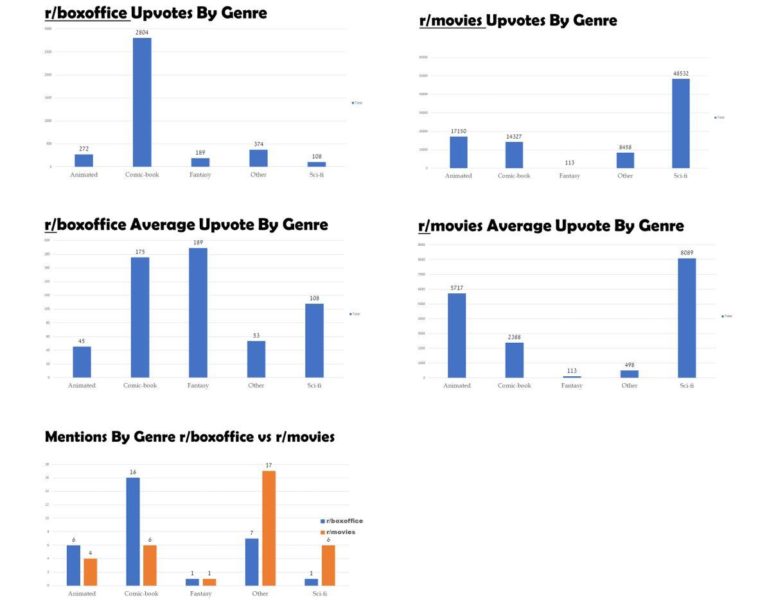
Data visualization : r/boxoffice vs r/movies Upvotes & Threads Counts by Genres 12/12/2018 [OC]
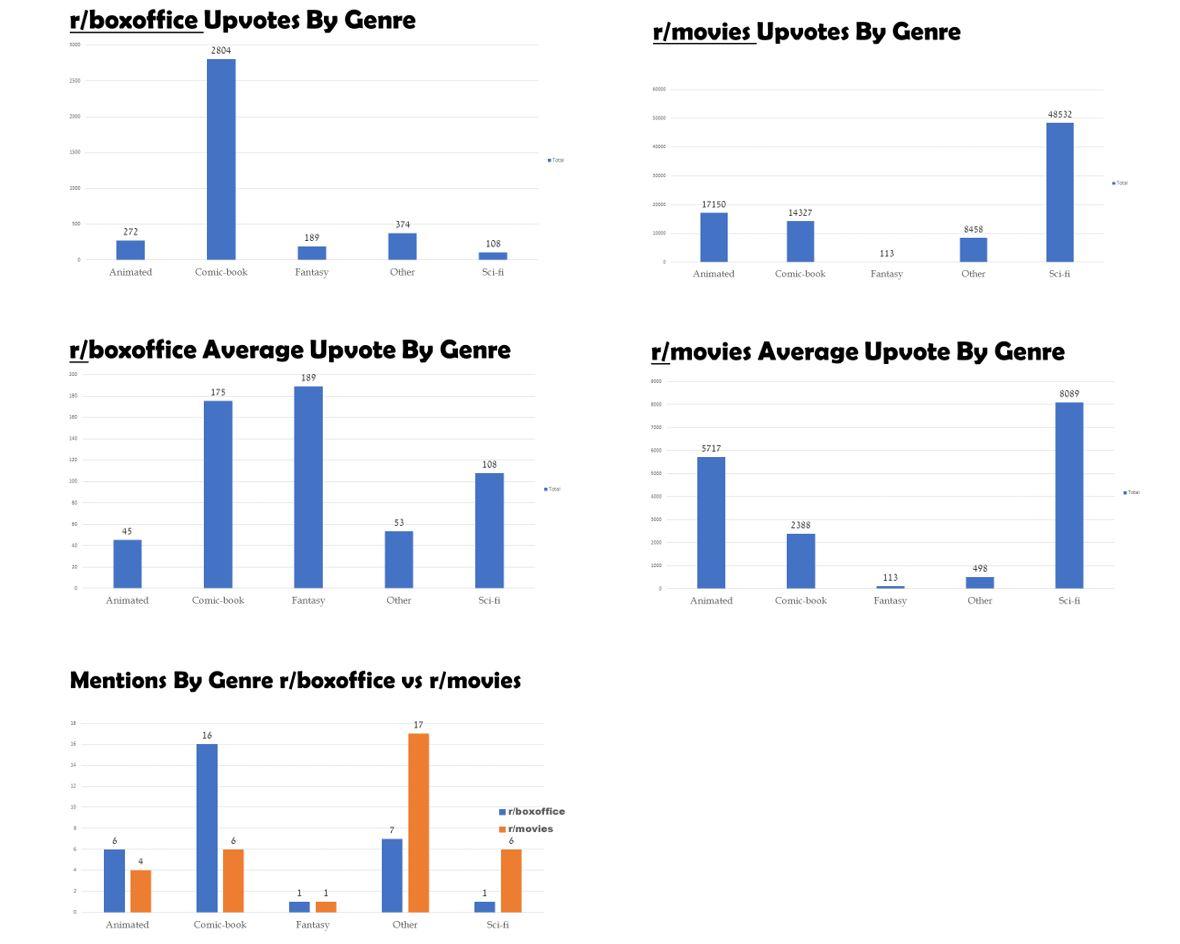
r/boxoffice vs r/movies Upvotes & Threads Counts by Genres 12/12/2018 [OC]
By waveduality
At infographic.tv we provide handpicked collection of the best infographics and data charts from around the world.