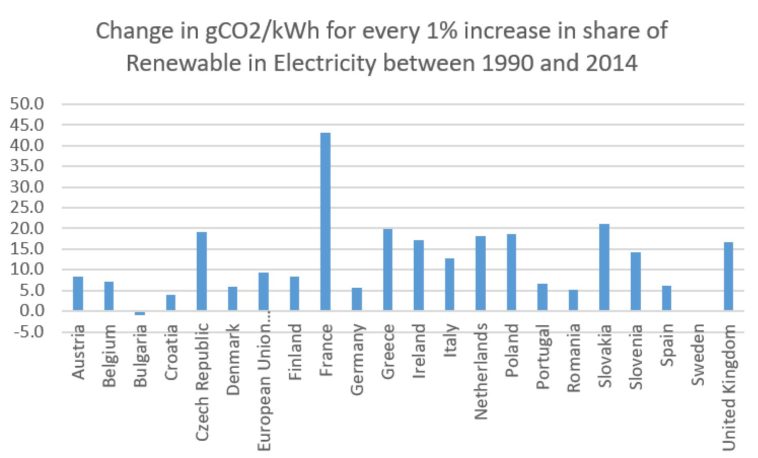
Data visualization : Reduction in Carbon Intensity (gCO2/kWh) for every 1% in increase in share of Renewable in Electricity Production between 1990 and 2014 [OC]
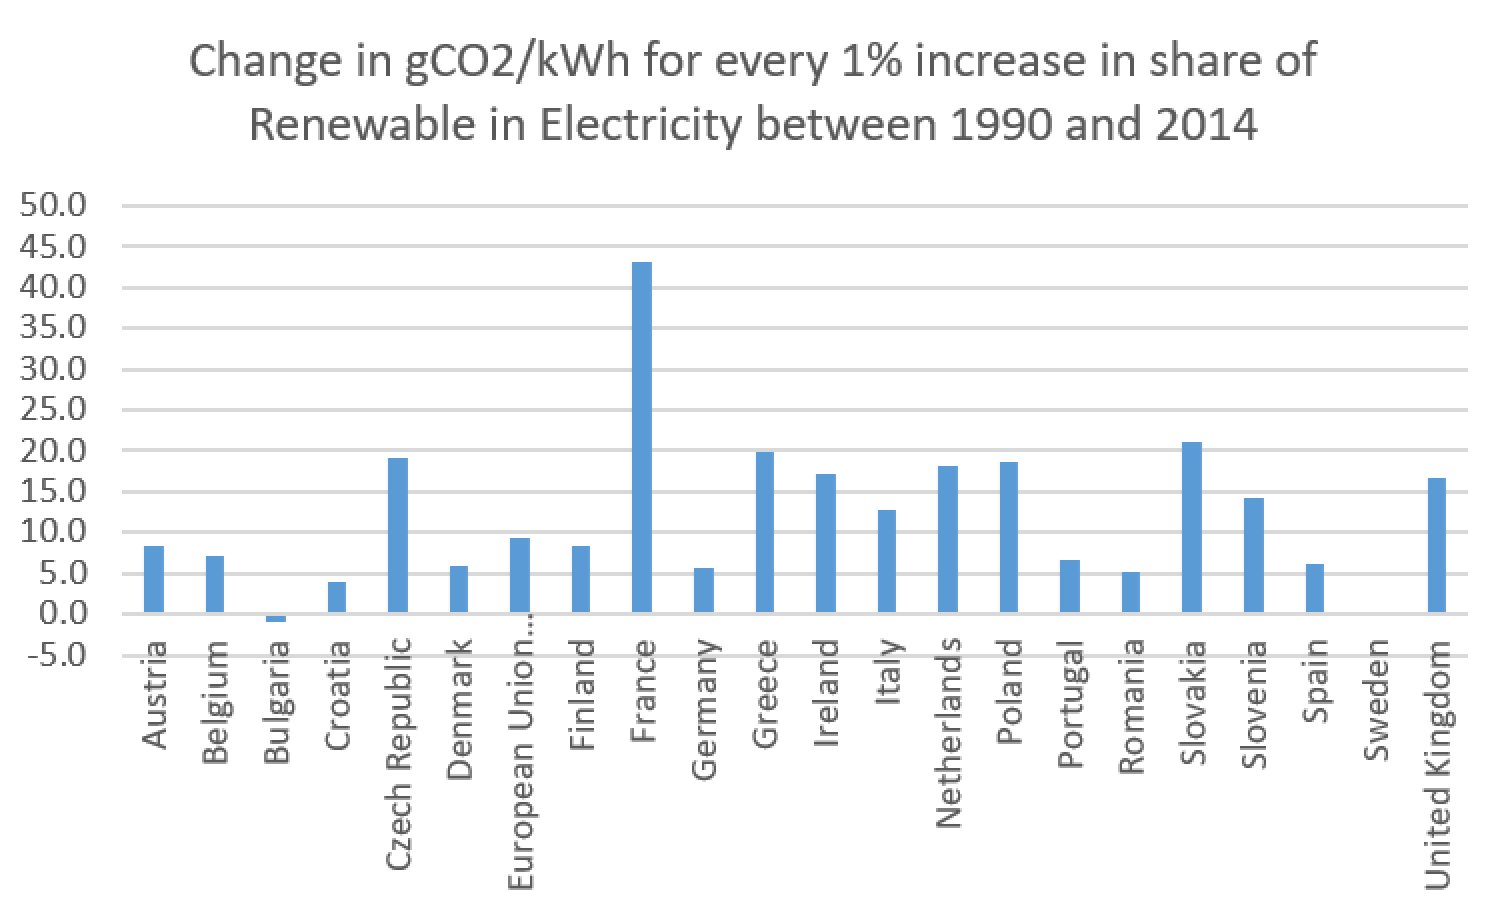
Reduction in Carbon Intensity (gCO2/kWh) for every 1% in increase in share of Renewable in Electricity Production between 1990 and 2014 [OC]
By 233C
At infographic.tv we provide handpicked collection of the best infographics and data charts from around the world.