Data visualization : Max travel distance per X hours in a mountainous area (hackathon project at fatmap.com) [OC]
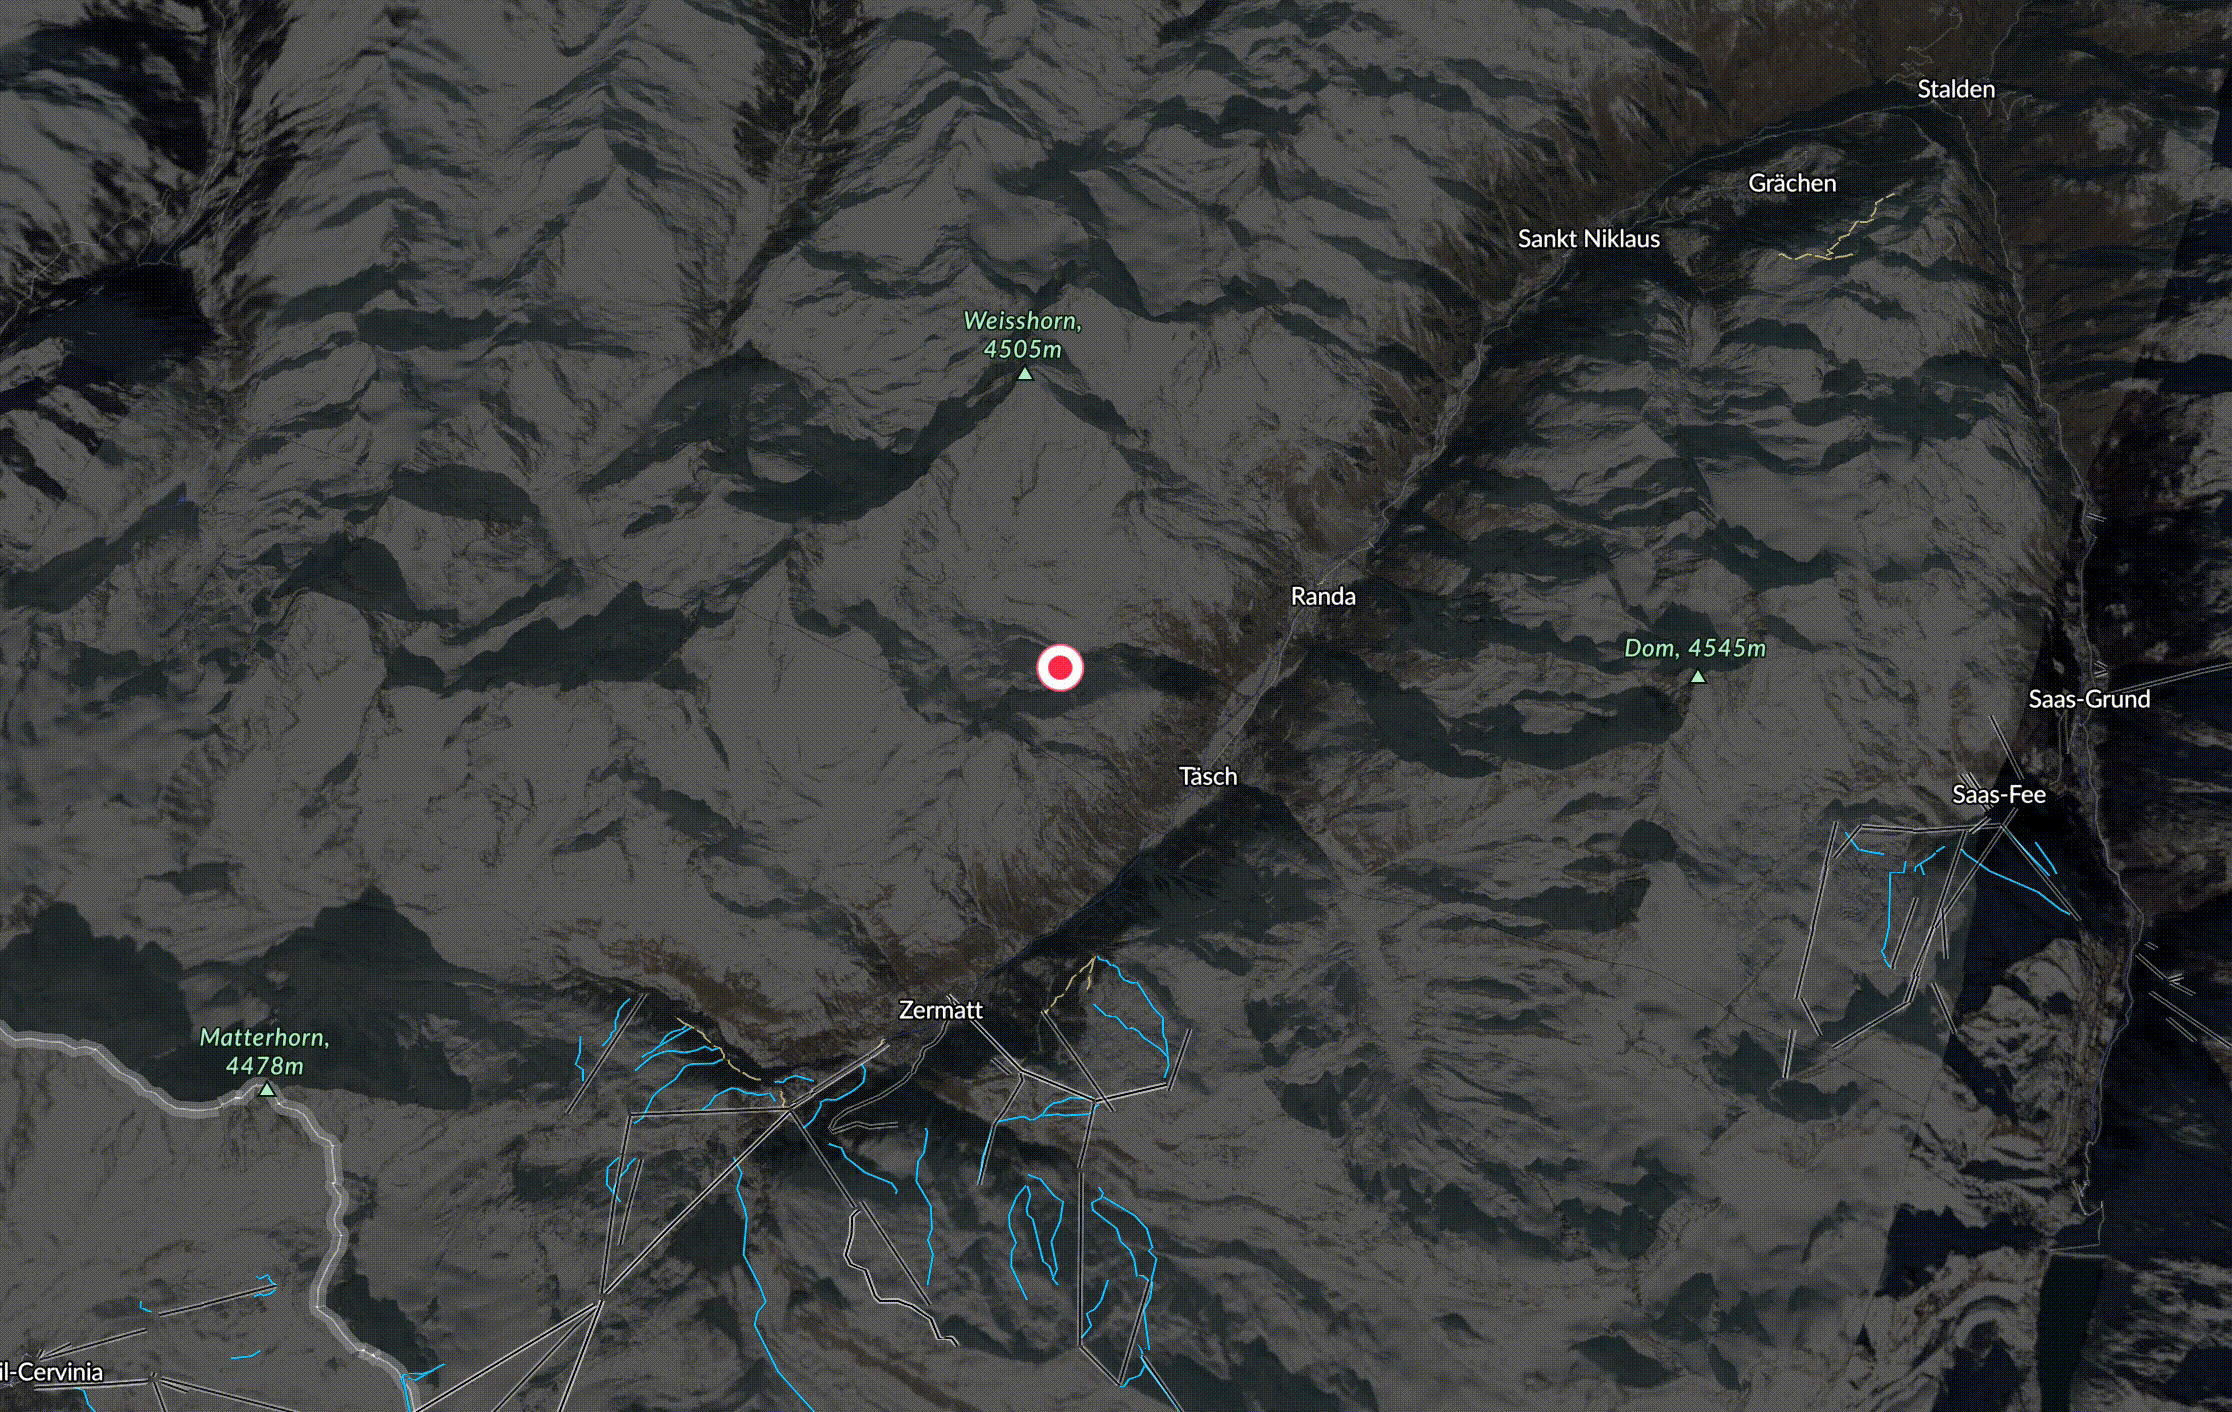
Max travel distance per X hours in a mountainous area (hackathon project at fatmap.com) [OC]
By PauliusLiekis
At infographic.tv we provide handpicked collection of the best infographics and data charts from around the world.