in Infographics Data Chart : A Complete History Of December 30, 2018, 10:50 pm 17.2k Views 0 Comments Data Chart : A Complete History Of infographic describes Rise of the Social Network Story Sharing is caring, don’t forget to share this infographic ! 0 shares What do you think? 459 Points Upvote Downvote Leave a Reply Cancel replyYour email address will not be published. Required fields are marked *Comment * Name * Email * Website Next post
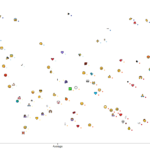
data visualization : Frequency Distribution of Emoji usage on Twitter between spam and non-spam tweets [OC]