Video Infographic : Infographics & Information Design | Graphic Design
Video
Description
Watch more How to Have a Career in Graphic Design videos:
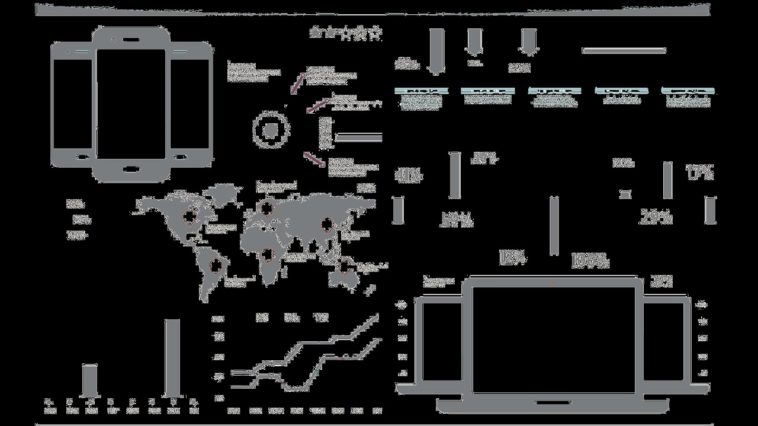
Infographic design is something that is very, very popular especially within the last couple of years, because we are trying to decide how can we make information exciting. Especially in an age where we are in the information age and we’re inputting, ingesting, and reading so much information on the daily basis that it not only has to be accurate, but also appealing.
So, infographics is a way to kind of break down massive amounts of data into pictures, into almost taking it back to an elementary approach where it’s like; ‘Okay, we have all this data. How can we best show it to the people, understand it, digest it, and share it?’ A couple of really really good sites to look at is ‘good.is’. They feature different, beautiful infographics from different people and agencies from, again, around the world, and it can range from anything. Some of them are ‘Unleash Your Inner-creativity’ or ‘Internet Social Media: Business Drivers’.
So a lot businesses actually use infographics to show why you should use their business. I know one of them, Rackspace, which is a hosting site, used an infographic that showed how much data is being stored in the world and why you should choose them.
Another thing to look at too, is a website called ‘Visually’, and you can actually create infographics from them or explore other infographics and also buy templates for making infographic design. And then ‘Column Five’ is a really good agency that is the leader in, not only regular infographics, but also interactive infographics.
So you may go to a graphic and then see that you can click on it, and then clicking on it, you’ll see more information as well. Infographics is not only about the design but also having a passion for data. So a lot of the times you may get a brief that has a whole bunch of data that you have break down into visual components and sometimes you won’t.
Sometimes you actually have to break down the data yourself in terms of ‘Okay, which data is most important to show through here, through icons?’. And you also want to make it simple, it’s almost like a logo, where you want to make sure that you’re not overusing the same icons over again, or using complicated graphics in which it almost looks like a photo rather than an actual infographic. So infographics, there’s really no right or wrong way, but it definitely is a really awesome field of design to explore, not only for its potential to help people learn, but also for its potential to help you advertise for your business. You know the first thing that we learn, even as a kid, is to recognize a stop sign, and recognize a shape, it’s a hexagon, or recognize the bathroom, male, female.
So you’re taught already to recognize shapes and to process it in a way where it’s like, ‘If these shapes are over here then it means this.’ and ‘If these shapes are over here and these colors are being used then it means that.’ So infographics has a way of literally breaking down what would be 50 pages of information into key points and being just enough for you to either explore more, or have enough working knowledge to get what you need out of it.


