Video Infographic : How to Create Filled Spheres in PowerPoint: (INFOGRAPHIC SERIES)
Video
Description
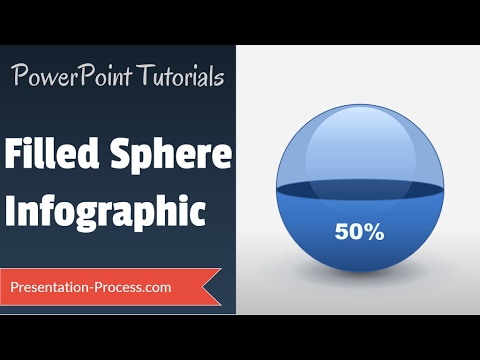
Learn to create filled Spheres infographics in PowerPoint with this tutorial. You can use this infographic diagram to showcase percentage fill or percentage completion of a project, target achievement etc.
The graphic includes multiple layers to create the glass bowl and gloss. The tutorial covers PowerPoint features like transparency and fill color gradient.
Find more such tutorials for infographics here:
You can find the templates showcased in this video here:
2 CEO Bundle


