Data visualization : The percentage of likes to dislikes for each year’s YouTube Rewind. [OC]
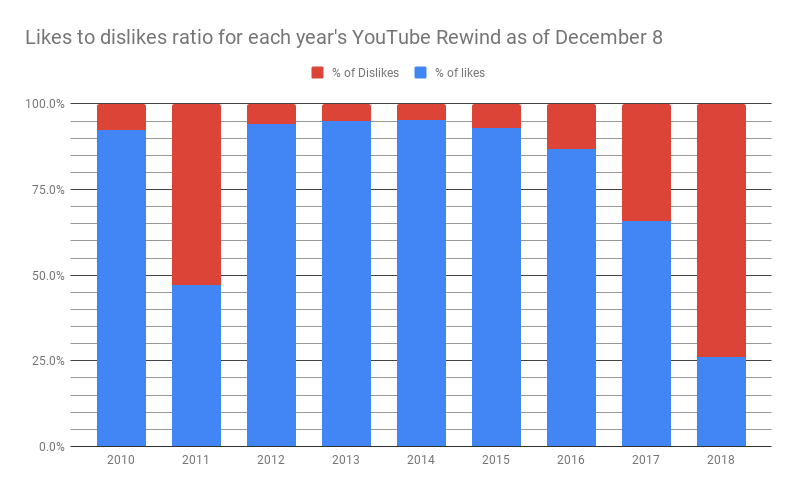
The percentage of likes to dislikes for each year’s YouTube Rewind. [OC]
By TydeOnReddit
At infographic.tv we provide handpicked collection of the best infographics and data charts from around the world.