Video Infographic : InfoGraphic Tutorial in Photoshop #05 – Circle Pie Chart
Video
Description
Please check my other videos at
Welcome to our channel- TutorialWebDesign.
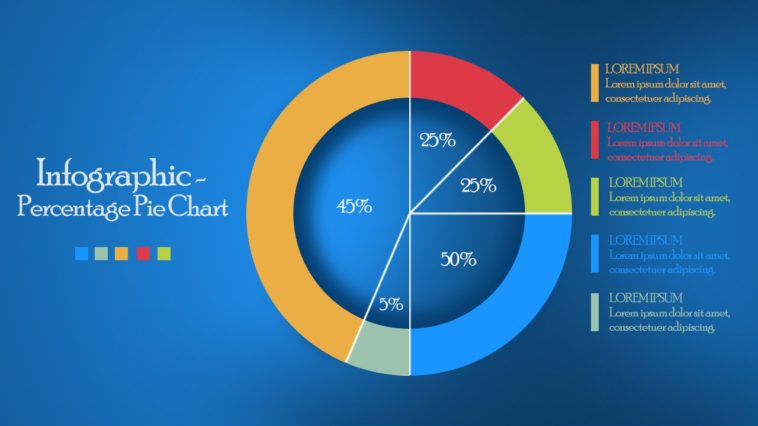
In this section of Photoshop Infographic tutorials, you will learn how to design Infographic circle percentage pie chart in Photoshop CC and Photoshop CS6. In this Photoshop InfoGraphic design tutorial, you will learn how to use Pen tool to give different colors to each circle segments. Learn how you can add and delete anchor points with pen tool in Photoshop.
Category: Photoshop Tutorials
Version : Photoshop CC, Photoshop CS6
Level : Beginner, Intermediate
Subcategory : InfoGraphic/Graphic Design Tutorial
Subject : Circle Infographic, Percentage Pie Chart Design in Photoshop
Connect with us :
Web site:
Twitter :
Facebook:
Google Plus :
In this Photoshop banner design tutorial, you will learn
1. How to show and hide the grids with short commands?
2. How to do masking in Photoshop?
3. How to separate shadow from the layer?
4. How t delete shadow from one side of the layer?
5. How to give different colors to one layer in Photoshop?
5. How to add, edit and delete anchor point in vector shape?
6. How to design vector banner in Photoshop.
7. How to design Percentage Pie Chart in Photoshop.
-~-~~-~~~-~~-~-
Please watch: “How to Design Cool Website Header in Photoshop | Web Design Tutorials”
-~-~~-~~~-~~-~-