Video Infographic : Easily create infographics in Power BI
Video
Description
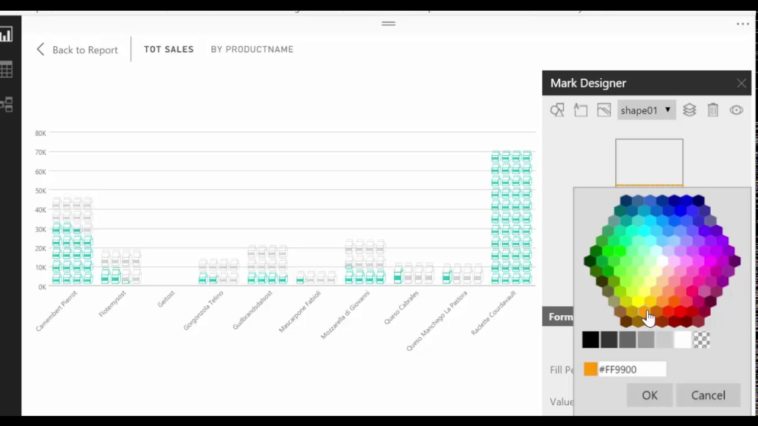
Do you want to create infographics in Power BI? In this video I will show you how to do just that!
Information graphics or infographics are graphic visual representations of information, data or knowledge intended to present information quickly and clearly. (Source: Wikipedia)
With Microsofts latest Power BI custom visual, you can now create infographics directly in Power BI. As this is a custom visual, rest assured that it will be updated on every power bi update. Enjoy!!
Links:
Link to demo file pbix:
Download the infografic:
Import data from Northwind datasource:
Guide to the infografic:
Keynotes:
00:38 Download the infografic
01:00 Import data from Northwind datasource
06:00 Show Microsoft example
07:00 Microsoft tutorial
Looking for a download file? Go to our Download Center:
SUBSCRIBE to learn more about Power and Excel BI!
Our PLAYLISTS:
– Join our DAX Fridays! Series:
– Power BI dashboards for beginners:
– Power BI Tips & Tricks:
– Power Bi and Google Analytics:
ABOUT CURBAL:
Website:
Contact us:
▼▼▼▼▼▼▼▼▼▼
If you feel that any of the videos, downloads, blog posts that I have created have been useful to you and you want to help me keep on going, here you can do a small donation to support my work and keep the channel running:
Many thanks in advance!
▲▲▲▲▲▲▲▲▲▲
QUESTIONS? COMMENTS? SUGGESTIONS? You’ll find me here:
► Twitter: @curbalen, @ruthpozuelo
► Google +:
► Facebook:
► Linkedin:


