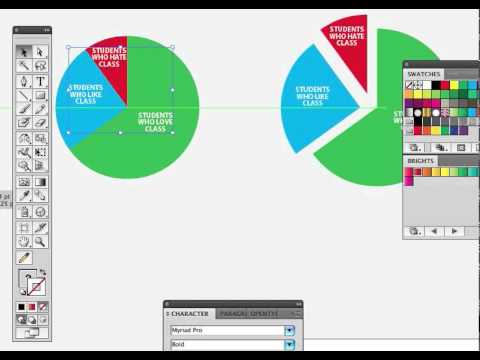
Video Infographic : Infographic Design 101: Intro to the graph tool in Adobe Illustrator
Video
Description
A tutorial that explains the basics of using the graph tool in Adobe Illustrator to create an accurate pie and bubble charts for infographic and information design.