Video Infographic : How to Create Charts, Reports, and Infographics with Infogram
Video
Description
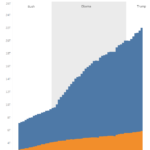
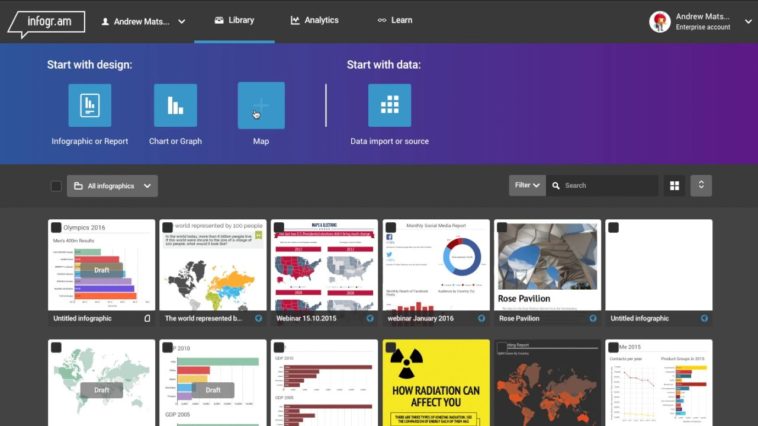
This getting started guide shows how Infogram can help you create beautiful charts (pie chart, line chart, word cloud, bar chart, etc), infographics, and maps.
Infogram is a data visualization company that helps people create charts, infographics, maps and reports. We show people how to communicate with data in a clear and engaging way
Visit the Infogram blog for more info: