Video Infographic : Build Impressive Charts: It’s NOT your usual Bar Chart (Infographics in Excel)
Video
Description
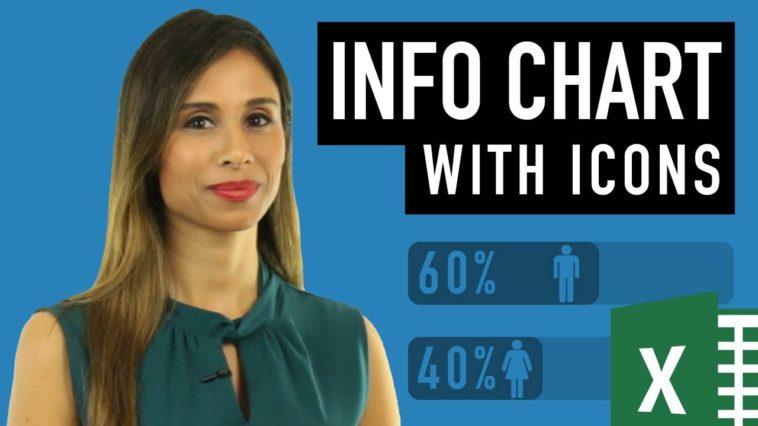
Create better Excel reports by improving your existing charts with the smart use of Icons.
In this video you learn how to create a bar chart that includes the male/female icon in a dynamic way (I will also show you how you can add shapes inside charts – this way, you can change your series to look like any shape of your choice) – you can of course replace these icons with any icon of your choice. You could for example use images of your products.
This is an example of how you can use some chart tricks that allow you to create infographics or infocharts in Excel. You don’t need to stick to the default chart types, you can improve on these to fit your corporate reporting style.
🡻 Download the workbook here 🡻
★ Links to related videos: ★
Special Excel Charts:
★ My Online Excel Courses ★
Courses ►
✉ Subscribe & get my TOP 10 Excel formulas e-book for free
EXCEL RESOURCES I Recommend:
Get Office 365:
Microsoft Surface:
GEAR
Camera:
Screen recorder:
Microphone:
Lights:
Note: This description contains affiliate links, which means at no additional cost to you, we will receive a small commission if you make a purchase using the links. This helps support the channel and allows us to continue to make videos like this. Thank you for your support!
#MsExcel


