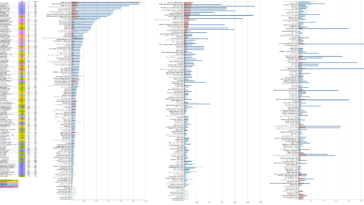
in Infographics Chart : Compiled gaming kill count data from multiple YouTube channels & infographics around the web. Plotted Total number of kills, kill rate (kills per hour, kph) & playtime. Sorted them from highest to lowest in 3 different graphs.
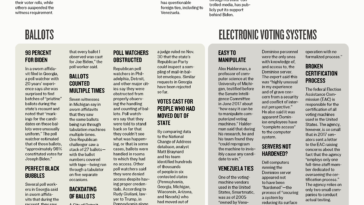
in Infographics Chart : An infographic that gives a general overview of the fraud seen in the 2020 American Presidential Election